FIGURE

Fig. 3

ID
ZDB-FIG-200902-3
Publication
Nguyen et al., 2020 - Generation and characterization of keap1a- and keap1b-knockout zebrafish
Other Figures
All Figure Page
Back to All Figure Page
Fig. 3

Altered genes and pathways in keap1a- and keap1b-knockout larvae.

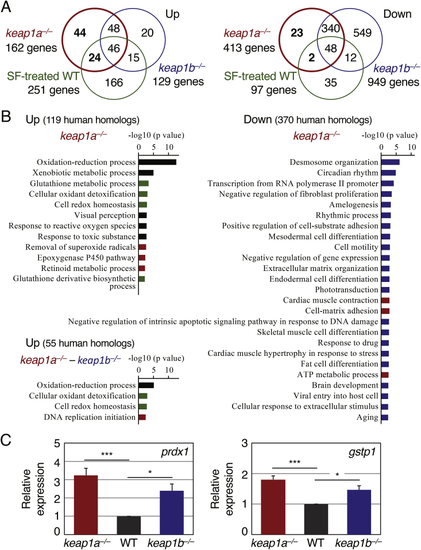
(A) Venn diagrams showing up- (left) and down-regulated genes (right) in 5-dpf larvae of keap1ait302-and keap1bit308-homozygous knockout larvae and of wild-type AB larvae treated with 40 μM sulforaphane identified by an RNA-seq analysis in comparison with untreated AB larvae.

(B) A GO enrichment analysis of biological processes in keap1a- and keap1b-knockout larvae. Red, blue, green and black bars indicate the processes enriched in only keap1a-knockout larvae, both keap1a- and keap1b-knockout larvae, both keap1a-knockout and sulforaphane-treated AB larvae, and all three larvae, respectively.

(C) The comparison of the basal expression of Nrf2 target genes between wild-type and Keap1 knockout larvae. The expression of prdx1 and gstp1 in wild-type AB, keap1a- and keap1b-knockout larvae at 5 dpf was analyzed by qPCR. The expression in wild-type specimens was normalized to 1. Each experiment was conducted at least four times with duplicate samples. Asterisks indicate significant differences (*p < 0.05, ***p < 0.001). (For interpretation of the references to colour in this figure legend, the reader is referred to the Web version of this article.)

Expression Data
Genes:
Fish:
Anatomical Term:
Stage: Day 5

Expression Detail
Antibody Labeling
Phenotype Data
Fish:
Observed In:
Stage: Day 5

Phenotype Detail
Acknowledgments
This image is the copyrighted work of the attributed author or publisher, and ZFIN has permission only to display this image to its users. Additional permissions should be obtained from the applicable author or publisher of the image. Full text @ Redox Biol.