
Fig. 1
- ID
- ZDB-FIG-200825-3
- Publication
- Kwon et al., 2020 - The Orphan G-Protein Coupled Receptor 182 Is a Negative Regulator of Definitive Hematopoiesis through Leukotriene B4 Signaling
- Other Figures
- All Figure Page
- Back to All Figure Page
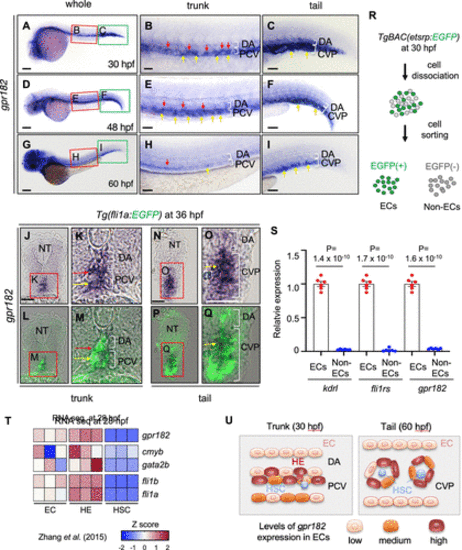
gpr182 is highly expressed in endothelial cells in zebrafish. (A–I) Brightfield images of whole-mount in situ hybridization (WISH) for gpr182 expression at 30 (A–C), 48 (D–F), and 60 (G–I) hpf. The red and green boxes in the left panels (A, D, G) are enlarged in the middle (B, E, H) and right (C, F, L) panels, respectively. Red and yellow arrows point to cells exhibiting strong expression of gpr182 in the ventral part of the DA (red) and in the PCV (yellow), respectively. Anterior to the left, dorsal to the top. (J–Q) Images of sectioned embryos after WISH for gpr182 expression in 36 hpf Tg(fli1a:EGFP) animals in the trunk (J–M) and tail (N–Q) region. The red boxes in panels J, K, N, and O are enlarged in their respective bottom panels (L, M, P, Q). Red and yellow arrows point to cells exhibiting strong expression of gpr182 in the ventral part of the DA (red) and in the PCV (yellow), respectively. (R) Schematic representation of EC sorting from 30 hpf TgBAC(etsrp:EGFP) embryos. (S) qPCR analysis of kdrl, fli1rs, and gpr182 mRNA expression levels in isolated ECs and non ECs from 30 hpf TgBAC(etsrp:EGFP)embryos. N = 6 biologically independent samples. A delta delta Ct (ΔΔCt) analysis was performed and EC expression levels were set at 1. Data are mean ± s.d., and a two-tailed Student’s t test was used to calculate Pvalues. The threshold cycle (Ct) values are in Table S2. (T) Heatmap analysis of gpr182 expression in nonhemogenic ECs (kdrl+/runx1–), specified HECs (HE, kdrl+/runx1+), and potential HSCs (kdrl–/runx1+) sorted from 28 hpf Tg(kdrl:mCherry/runx1:EGFP) embryos.(18)Heatmap was generated according to z-score of reads per kilobase per million reads (RPKMs) of each gene in multiple samples. RPKM and z-scores are summarized in Figure S1(A). (U) Schematic illustration showing gpr182 expression in ECs in the trunk (30 hpf) and tail (60 hpf) region. Scale bars, 200 μm (A, D, G), 50 μm (B, C, E, F, H, I, J–Q). CVP, caudal vein plexus; DA, dorsal aorta; ISV, intersegmental vessel; NC, notochord; NT, neural tube; PCV, posterior cardinal vein. |
| Genes: | |
|---|---|
| Fish: | |
| Anatomical Terms: | |
| Stage Range: | Prim-15 to Pec-fin |