FIGURE

Fig. 6

ID
ZDB-FIG-200801-7
Publication
Cang et al., 2020 - Inferring spatial and signaling relationships between cells from single cell transcriptomic data
Other Figures
All Figure Page
Back to All Figure Page
Fig. 6

Application of SpaOTsc to spatial transcriptomic data and their integrations with scRNA-seq datasets.

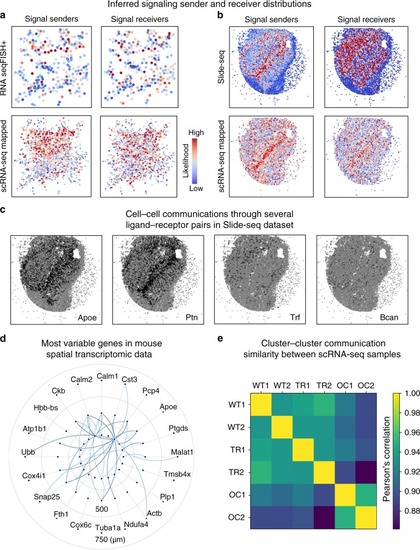
The Slide-seq data, the RNA seqFISH+ data, and the scRNA-seq data for mouse olfactory bulb were taken from ref. 51, ref. 52, and ref. 53, respectively. a, b Spatial distributions of signal senders and receivers with the color showing the likelihood of being a sender or receiver. Top row: inference using only spatial transcriptomics data. Bottom row: the inferred signaling in scRNA-seq data (sample WT1) visualized by mapping the single cells to space using spatial transcriptomic data. c Signaling for four individual marked ligands in the Slide-seq data. d The intercellular gene–gene regulatory information flow of the top 20 variable genes in the Slide-seq data. e Similarities on cluster–cluster communication between the six samples of the scRNA-seq data integrated with the RNA seqFISH+ data measured by Pearson’s correlation coefficient.

Expression Data

Expression Detail
Antibody Labeling
Phenotype Data

Phenotype Detail
Acknowledgments
This image is the copyrighted work of the attributed author or publisher, and ZFIN has permission only to display this image to its users. Additional permissions should be obtained from the applicable author or publisher of the image. Full text @ Nat. Commun.