FIGURE

FIGURE 3

ID
ZDB-FIG-200614-20
Publication
Van Der Meulen et al., 2020 - Spatiotemporal Characterization of Anterior Segment Mesenchyme Heterogeneity During Zebrafish Ocular Anterior Segment Development
Other Figures
All Figure Page
Back to All Figure Page
FIGURE 3

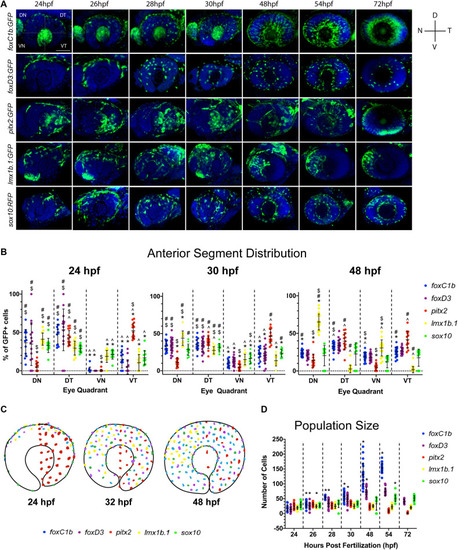
Periocular mesenchyme subpopulation distribution analysis. (A) 3D rendering of confocal stacks encompassing the AS in POM transgenic lines between 24 and 72 hpf. GFP+ cells are green, DNA was stained with DAPI (blue). DN, dorsal-nasal; DT, dorsal-temporal; VN, ventral-nasal; VT, ventral-temporal. Scale bar = 50 μm. (B) Distribution of quantified GFP+ cells within each AS quadrant (DN, DT, VN, and VT) at 24, 30, and 48 hpf. Distribution is represented as an average percentage of the total number of GFP+ in each quadrant of the AS for each transgenic line. Statistically significant difference (p < 0.05): * vs. DT, # vs. VN, $ vs. VT and ^ vs. DN. (C) Model of POM colonization at 24, 30, and 48 hpf. (D) Average AS cell population size for each transgenic line at 24–72 hpf. * indicates statistically significant (p < 0.05) change from previous time point.

Expression Data

Expression Detail
Antibody Labeling
Phenotype Data

Phenotype Detail
Acknowledgments
This image is the copyrighted work of the attributed author or publisher, and ZFIN has permission only to display this image to its users. Additional permissions should be obtained from the applicable author or publisher of the image. Full text @ Front Cell Dev Biol