
Figure S7
- ID
- ZDB-FIG-200610-21
- Publication
- Liao et al., 2019 - RNA Granules Hitchhike on Lysosomes for Long-Distance Transport, Using Annexin A11 as a Molecular Tether
- Other Figures
- All Figure Page
- Back to All Figure Page
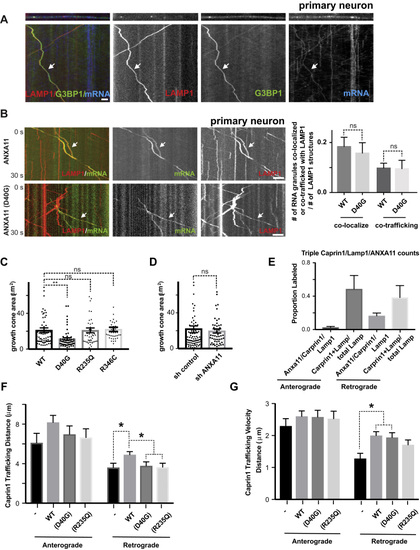
ALS-Associated Mutations in ANXA11 Disrupt RNA Granule Hitchhiking on Lysosomes in Axons from Rat Cortical Neurons and Zebrafish Neurons, Related to (A) Kymographs showing RNA granule protein and mRNA co-transport on the same lysosomes in axons. Rat cortical neurons were transduced with LAMP1-HaloTag to label lysosomes (red), and mCherry-G3BP1 to label RNA granules (green), and actin-24xMBS/ MCP-NLS-2xEGFP(blue). Time-lapse movies of axons were then acquired at 100ms/frame for 30 seconds and displayed in kymograph format. Arrows point to a example of both G3BP1 and mRNA co-trafficking with lysosomes. Scale bar: 5 μm. (B) Kymographs showing the effect of ALS-associated ANXA11 mutants on RNA co-trafficking with lysosomes in rat neuron axons. Rat cortical neurons were transduced with LAMP1-HaloTag to label lysosomes (red), actin-24xMBS/ MCP-NLS-2xEGFP (green) and ANXA11 (upper panel) or ANXA11 (D40G) (bottom panel). Time-lapse movies of axons were then acquired at 100ms/frame for 30 seconds and displayed in kymograph format. Arrows point to an example of RNA granule co-trafficking with lysosomes. Scale bar: 5 μm. Quantification of RNA granule co-localization or co-trafficking with lysosomes in axons expressing either ANXA11 or ANXA11 p. D40G mutation (relative to lysosome number). n=36 (WT), 12 (D40G). One-way ANOVA. ns, not significant. Error bars = SEM. (C) Quantification of growth cone area in axons expressing either ANXA11 or mutant ANXA11. N=61(WT), 56(D40G), 46(R235Q), 39(R346C). One-way ANOVA. ∗∗, p<0.01, ns, not significant. Error bars = SEM. (D) Quantification of growth cone area in axons expressing either ANXA11 or mutant ANXA11. N= 80(sh control), 54(sh ANXA11). unpaired t-test. ns, not significant. Error bars = SEM. (E) Quantification of vesicles triple labeled with CAPRIN1/LAMP1/ANXA11 over the total LAMP1 vesicles undergoing anterograde or retrograde transport in zebrafish axons. N=9-18. (F) Quantification of trafficking distance for CAPRIN1 vesicles in zebrafish axons. N=9-18. Two-way ANOVA with Tukey post-hoc analysis, ns, not significant. ∗p < 0.05. Error bars = SEM. (G) Quantification of trafficking velocity for CAPRIN1 vesicles in zebrafish axons. N=9-18. Two-way ANOVA with Tukey post-hoc analysis. ∗p < 0.05. Error bars = SEM. |
Reprinted from Cell, 179, Liao, Y.C., Fernandopulle, M.S., Wang, G., Choi, H., Hao, L., Drerup, C.M., Patel, R., Qamar, S., Nixon-Abell, J., Shen, Y., Meadows, W., Vendruscolo, M., Knowles, T.P.J., Nelson, M., Czekalska, M.A., Musteikyte, G., Gachechiladze, M.A., Stephens, C.A., Pasolli, H.A., Forrest, L.R., St George-Hyslop, P., Lippincott-Schwartz, J., Ward, M.E., RNA Granules Hitchhike on Lysosomes for Long-Distance Transport, Using Annexin A11 as a Molecular Tether, 147-164.e20, Copyright (2019) with permission from Elsevier. Full text @ Cell