
Figure 6
- ID
- ZDB-FIG-200610-18
- Publication
- Liao et al., 2019 - RNA Granules Hitchhike on Lysosomes for Long-Distance Transport, Using Annexin A11 as a Molecular Tether
- Other Figures
- All Figure Page
- Back to All Figure Page
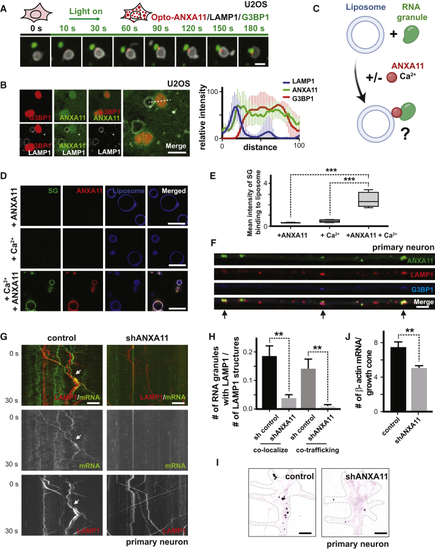
ANXA11 Acts as an Adaptor between RNA Granules and Lysosomes (A) Time-lapse imaging of U2OS cells expressing LAMP1-HaloTag, Opto-ANXA11 and mEmerald-G3BP1 after 488nm light exposure to induce Opto-ANXA11 oligomerization. U2OS cells were exposed to heat shock (43 oC) for 15 minutes prior to light activation to form visible G3BP1 stress granules. Stress granules (green) associate with LAMP1-labeled lysosomes (white) at sites where ANXA11 puncta (red) are localized. Scale bar: 1 μm. See also (B) Live cell confocal imaging of U2OS expressing LAMP1-HaloTag, ANXA11-mEmerald and mCherry-G3BP1 following 30 minutes of heat shock (43oC). Quantification of the intensity profiles of the different probes across midline of stress granules (dotted line) is shown to right. n=6, Error bars = SEM. Scale bar: 1μm. (C) Schematic of (D) Stress granule cores were purified from cultured cells, and incubated with PI3P containing liposomes +/– recombinant ANXA11 +/– Ca2+. Upper panel: + ANXA11 only, Middle panel: + Ca2+only, Bottom panel: + both ANXA11 and Ca2+. Scale bar=10 μm. (E) Quantification of mean intensity of stress granule binding to PI3P containing liposomes in (F) Co-localization of ANXA11, lysosomes, and RNA granules in axons. Rat cortical neurons were transduced with LAMP1-HaloTag to label lysosomes, ANXA11-mEmerald to label ANXA11, and mCherry-G3BP1 to label RNA granules. Arrows indicate areas of ANXA11, lysosome and RNA granule co-localization. Scale bar: 5 μm. See also (G) ANXA11 knockdown perturbs mRNA/lysosome co-trafficking in axons. Kymographs of mRNA (actin-24xMBS/ MCP-NLS-2xEGFP) and lysosome (LAMP1-HaloTag) trafficking in axons is shown. Rat neurons expressed control or ANXA11-targeting shRNAs. Scale bar: 5 μm. (H) Quantification of (I) smFISH of beta-actin in growth cones from neuron expressing control shRNA (left panel) or ANXA11 shRNA (right panel). Black colored spots represent the signal from beta-actin smFISH probes, red signal represents membrane stain of growth cones. Scale bar: 1 μm. (J) Quantification of average number of beta-actin mRNA molecules in |
Reprinted from Cell, 179, Liao, Y.C., Fernandopulle, M.S., Wang, G., Choi, H., Hao, L., Drerup, C.M., Patel, R., Qamar, S., Nixon-Abell, J., Shen, Y., Meadows, W., Vendruscolo, M., Knowles, T.P.J., Nelson, M., Czekalska, M.A., Musteikyte, G., Gachechiladze, M.A., Stephens, C.A., Pasolli, H.A., Forrest, L.R., St George-Hyslop, P., Lippincott-Schwartz, J., Ward, M.E., RNA Granules Hitchhike on Lysosomes for Long-Distance Transport, Using Annexin A11 as a Molecular Tether, 147-164.e20, Copyright (2019) with permission from Elsevier. Full text @ Cell