
Figure 7
- ID
- ZDB-FIG-200610-20
- Publication
- Liao et al., 2019 - RNA Granules Hitchhike on Lysosomes for Long-Distance Transport, Using Annexin A11 as a Molecular Tether
- Other Figures
- All Figure Page
- Back to All Figure Page
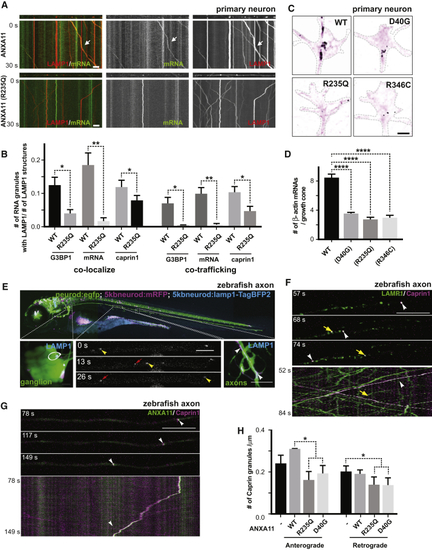
Effects of ALS-Associated ANXA11 Mutations on Axonal RNA Granule/Lysosome Hitchhiking (A) Kymographs of mRNA (actin-24xMBS/ MCP-NLS-2xEGFP ) and lysosome (LAMP1-HaloTag) trafficking in rat neuron axons expressing wild-type or R235Q mutant ANXA11. Arrows point to examples of mRNA co-trafficking with lysosomes. Scale bar: 10 μm. (B) Quantification of (C) smFISH of beta-actin in growth cones from rat neurons expressing wild-type or mutant ANXA11. Black colored spots represent the signal from beta-actin smFISH probes, red signal represents membrane stain of growth cones. Scale bar: 1 μm. (D) Quantification of (E) Lysosome trafficking in live zebrafish embryo ganglion axons. Lysosomes were labeled with LAMP1-TagBFP2 in zebrafish pLL ganglions; insets show ganglion (left) and axon tips (right). Time-lapse imaging reveals bi-directional lysosomal trafficking in these axons (bottom middle panels). (F) Imaging of live zebrafish neurons reveals bi-directional co-trafficking of CAPRIN1-positive RNA granules with lysosomes in axons. Yellow arrows point to anterograde co-trafficking of LAMP1 (green) and CAPRIN1 (magenta); white arrows point to retrograde co-trafficking of LAMP1 (green) and CAPRIN1 (magenta). Corresponding kymograph shown below. See also (G) Imaging of live zebrafish neurons expressing ANXA11 and CAPRIN1 reveals co-trafficking of ANXA11-labeled structures (green) with CAPRIN1 (magenta) in axons. Corresponding kymograph shown below. See also (H) Effect of ANXA11 ALS-associated mutations on trafficking of CAPRIN1-labeled RNA granules in zebrafish axons. CAPRIN1 and wild-type or mutant ANXA11 were expressed in zebrafish ganglion. Anterograde or retrograde trafficking of CAPRIN1 vesicles per μm along the axon length were quantified in each group. n = 9-18. Two-way ANOVA with Tukey post-hoc analysis, ∗p < 0.05. Error bars = SEM. See also |
Reprinted from Cell, 179, Liao, Y.C., Fernandopulle, M.S., Wang, G., Choi, H., Hao, L., Drerup, C.M., Patel, R., Qamar, S., Nixon-Abell, J., Shen, Y., Meadows, W., Vendruscolo, M., Knowles, T.P.J., Nelson, M., Czekalska, M.A., Musteikyte, G., Gachechiladze, M.A., Stephens, C.A., Pasolli, H.A., Forrest, L.R., St George-Hyslop, P., Lippincott-Schwartz, J., Ward, M.E., RNA Granules Hitchhike on Lysosomes for Long-Distance Transport, Using Annexin A11 as a Molecular Tether, 147-164.e20, Copyright (2019) with permission from Elsevier. Full text @ Cell