
Figure 1
- ID
- ZDB-FIG-200426-6
- Publication
- Bertolini et al., 2019 - Mapping the Global Chromatin Connectivity Network for Sox2 Function in Neural Stem Cell Maintenance
- Other Figures
- All Figure Page
- Back to All Figure Page
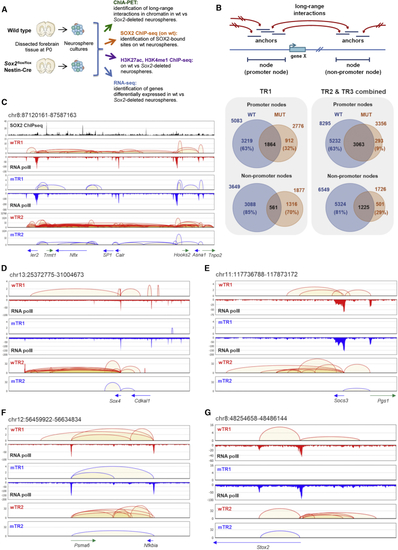
(A) Functional genomics analyses. (B) Top: “anchors” and “nodes” connected by long-range interactions; bottom: numbers of promoter/non-promoter nodes in WT and MUT NSCs, left: TR1 and right: TR2 and TR3 combined. (C–G) Connectivity diagrams in WT NSCs (WT interactions; red) and MUT NSCs (MUT interactions; blue), across 5 different chromosome regions, in the wTR1, wTR2, and mTR1, mTR2 analysis; regions coordinates are: chr8:87120161-87587163 (C), chr13:25372775-31004673 (D), chr11:117736788-117873172 (E), chr12:56459922-56634834 (F) and chr8:48254658-48486144 (G). Their genomic coordinates are indicated above each panel, and genes within each region shown below the panels. Pol II- and SOX2-binding peaks are shown. PET counts (Y axes); note different (log10) scales in some panels. In MUT NSCs, an overall decrease of “looping” is seen, but some interactions are lost, others are maintained. Note the persistence of Pol II binding in MUT NSCs and the frequent coincidence (in C) of SOX2 peaks with interaction anchors. See also |