
Figure 5
- ID
- ZDB-FIG-200426-10
- Publication
- Bertolini et al., 2019 - Mapping the Global Chromatin Connectivity Network for Sox2 Function in Neural Stem Cell Maintenance
- Other Figures
- All Figure Page
- Back to All Figure Page
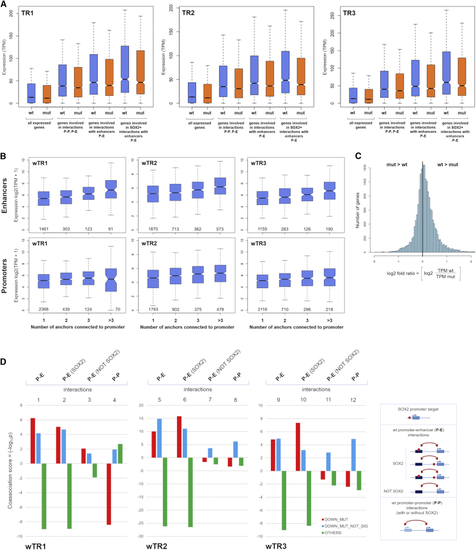
Reduced Gene Expression in (A) Distribution of expression values (TPM) of genes with TPM >0. Blue, WT NSCs; orange, MUT NSCs. From left to right: all genes; genes whose promoter is a node (P-P, P-E interactions); genes whose promoter is connected to an enhancer (P-E interactions); genes with SOX2-positive P-E interactions. (B) Distribution of expression values (y axis) of genes according to the number and type of element (enhancer or promoter anchors) interacting with the gene promoter (x axis) in wTR1, wTR2, and wTR3. Top: interactions with enhancers. Bottom: interactions only with promoters. The number of genes involved is shown in each diagram inside the box along the x axis. (C) Distribution of the fold ratio values for all genes with TPM >0 defined as log2 (TPM_WT/TPM_MUT). It confirms results shown in (B): the fold ratio is shifted toward positive values (i.e., a majority of genes have expression in WT higher than in MUT NSCs). (D) Coassociation scores (histograms, -log10 See also |