
Fig. 9
- ID
- ZDB-FIG-200117-29
- Publication
- Ahsan et al., 2019 - Prickle1 is required for EMT and migration of zebrafish cranial neural crest
- Other Figures
- All Figure Page
- Back to All Figure Page
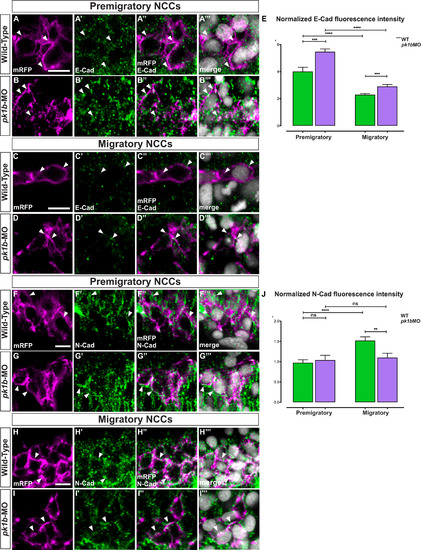
Pk1b regulates E-Cad levels in pre-migratory and migratory NCCs and N-Cad levels in migratory NCCs. To investigate the effect of Pk1b-knockdown on the levels of E-Cad (Cdh1) and N-Cad (Cdh2), immunolabeling at 16 hpf embryos was used to assay both pre-migratory and migratory NCCs, which were defined based on their z-position relative to the most dorsally located NCCs. Pre-migratory NCCs were defined as those located within 7 µm of the most dorsal position; the migratory cells imaged were located between 16 and 37 µm of the most dorsal position. (A-D) Tg(sox10:mRFP) embryos were immunolabeled for E-Cad (Cdh1) (A′-D′), and counterstained with DAPI to mark nuclei (A′′′-D′′′). Scale bar = 10 µm. White arrowheads indicate levels of E-Cad in NCCs with labeled membranes and nuclei. Merged channels are also shown (A′′-D′′′). (A-A′′′) In pre-migratory NCCs, E-Cad is present at high levels in WT specimens (A′), with puncta localizing largely on the membrane (A′′). (B-B′′′) In pk1b-morphant specimens, E-Cad levels are elevated (B’) with more puncta localizing on the membrane (B′′) as compared to WT (compare A′′ and B′′). (C-C′′′) In migratory NCCs, E-Cad is present at reduced levels (C′, C′′) as compared to pre-migratory NCCs (compare C′′ and A′′). (D-D′′′). In pk1b-morphant specimens, E-Cad levels are elevated (D′) with more puncta localizing on the membrane (D′’) as compared to WT (compare C′′ and D′′). (E) To quantify the levels of E-Cad in different conditions, fluorescence pixel intensity was measured. Each cell was normalized by subtracting background pixel intensity and dividing the remainder by the area of the cell. High levels of E-Cad were found in pre-migratory WT cells (n = 92 cells, 4 embryos). E-Cad levels in pk1b-deficient NCCs (n = 73 cells, 4 embryos) were significantly elevated as compared to WT NCCs (***, p = 0.0002). E-Cad levels in migratory WT cells (n = 100 cells, 4 embryos), were significantly reduced as compared to levels in pre-migratory WT cells (****, p < 0.0001), however pk1b-morphant migratory NCCs (n = 65, 4 embryos) showed significantly higher levels of E-Cad as compared to WT migratory NCCs (***, p = 0.0006). Similarly, (F-I) Tg(sox10:mRFP) embryos were immunolabeled for N-Cad (Cdh2) and counterstained with DAPI to mark nuclei (F′′-I′′′). White arrowheads indicate levels of N-Cad in NCCs with labeled membranes and nuclei. Merged channels are also shown (F′′-I′′). (F-F′′′) In pre-migratory NCCs, N-Cad (F′) is highly localized at the membrane in WT specimens (F′′). (G-G′′′) In pk1b-morphant specimens, N-Cad levels (G′) showed no discernable difference in localization on the membrane (G′’) as compared to WT (compare G′′ and F′′). (H-H′′′) In migratory NCCs, N-Cad is present at increased levels as compared to pre-migratory NCCs (compare H′′ and F′′). (I-I′′′) However, in pk1b-morphant specimens, N-Cad levels in migratory NCCs are decreased (I’) with less N-Cad localization on the membrane (I′’) as compared to WT (compare I′′ and H′′). (J) To quantify the levels of N-Cad in different conditions, fluorescence pixel intensity was measured and normalized in the same manner as with E-Cad. N-Cad was present on the membrane in pre-migratory WT NCCs (n = 164 cells, 5 embryos). N-Cad levels in pk1b-morphant NCCs (n = 204 cells, 4 embryos) showed no difference to WT NCCs (p > 0.05). N-Cad levels in migratory WT cells (n = 192 cells, 5 embryos), were significantly elevated as compared to levels in pre-migratory WT NCCs (****, p < 0.0001), however pk1b-morphant migratory NCCs (n = 189, 4 embryos) showed significantly lower levels of N-Cad as compared to WT migratory NCCs (**, p = 0.0027). N-Cad levels in WT pre-migratory, pk1b-morphant pre-migratory, and pk1b-morphant NCCs showed no significant difference from each other (p > 0.05 for each combination). |
| Gene: | |
|---|---|
| Antibody: | |
| Fish: | |
| Knockdown Reagent: | |
| Anatomical Terms: | |
| Stage: | 14-19 somites |
| Fish: | |
|---|---|
| Knockdown Reagent: | |
| Observed In: | |
| Stage: | 14-19 somites |
Reprinted from Developmental Biology, 448(1), Ahsan, K., Singh, N., Rocha, M., Huang, C., Prince, V.E., Prickle1 is required for EMT and migration of zebrafish cranial neural crest, 16-35, Copyright (2019) with permission from Elsevier. Full text @ Dev. Biol.