
FIGURE
Figure 5
- ID
- ZDB-FIG-191230-28
- Publication
- Lechermeier et al., 2019 - Transcript Analysis of Zebrafish GLUT3 Genes, slc2a3a and slc2a3b, Define Overlapping as Well as Distinct Expression Domains in the Zebrafish (Danio rerio) Central Nervous System
- Other Figures
- All Figure Page
- Back to All Figure Page
Figure 5
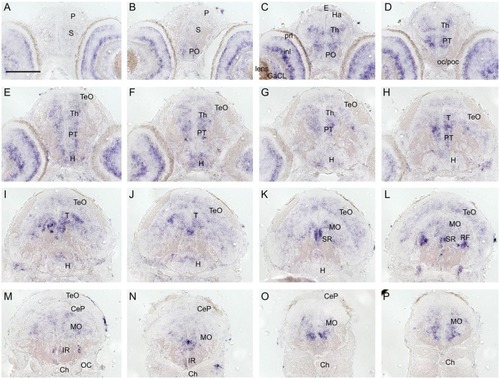
Cryosections (20 μm) of 120 hpf embryo processed for RNA |
Expression Data
| Gene: | |
|---|---|
| Fish: | |
| Anatomical Terms: | |
| Stage: | Day 5 |
Expression Detail
Antibody Labeling
Phenotype Data
Phenotype Detail
Acknowledgments
This image is the copyrighted work of the attributed author or publisher, and
ZFIN has permission only to display this image to its users.
Additional permissions should be obtained from the applicable author or publisher of the image.
Full text @ Front. Mol. Neurosci.