|
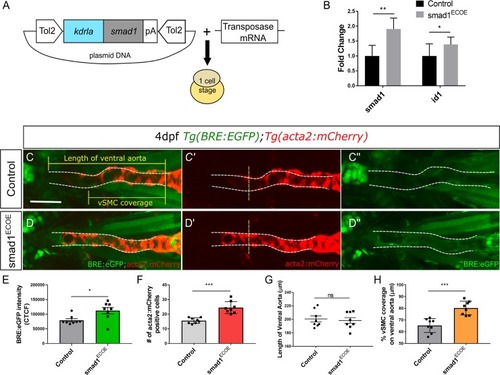
<italic>smad1</italic> overexpression in endothelial cells results in increased vSMC coverage.A) Vector construct for overexpression of smad1 under the endothelial cell promoter kdrla. B) RT-qPCR fold change in smad1 and id-1 expression levels in endothelial specific smad1 overexpressing embryos (smad1ECOE) embryos at 4 dpf (n = 3). RT-qPCR data show the mean ± SEM, Student's two-tailed t-test *p < 0.05, n, number of biological replicates. C–D) Representative orthogonal projections of ventral views of 4 dpf Tg(BRE:EGFP); Tg(acta2:mCherry) embryos. Control embryos (C-C”) and smad1ECOE embryos (D-D”) showing endothelial BRE:EGFP and vSMC acta2:mCherry expression in the ventral aorta (VA) and pharyngeal arch arteries (PAA). E) Quantification of green fluorescent marker (BRE:EGFP) along the VA, highlighted within the yellow region in C” and D”, as corrected total cell fluorescence (CTCF). F) Quantification of acta2 positive cell number on VA, within area outlined in C and D. Number of acta2 positive cells is significantly increased in smad1ECOE embryos. G) Quantification of length of VA, within area outlined in C and D. H) Quantification of the percent vSMC coverage of ventral aorta. For each quantification, N = 3, smad1ECOE embryos n = 8, Control n = 8, Student's two-tailed t-test, *-***p< 0.01–0.0001 as compared to control. Error bars = SEM, Scale bar represents 50μm.
|