|
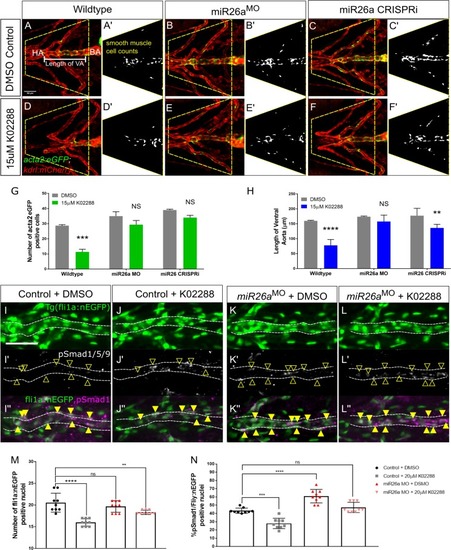
<italic>miR26a</italic> controls vSMC differentiation via <italic>smad1</italic>-mediated BMP signaling.Ventral aorta showing endothelial (red) and smooth muscle (green) cells in miR26a morphants or CRISPRi- injected embryos treated with vehicle control (DMSO) or 15μM K02288 from 52 hpf to 4 dpf. A-C) DMSO-treated vehicle control embryos. D-F) K02288 treated control embryos. (A, D), miR26a morphant (B, E), miR26a CRISPRi knockdown (C, F). A’-F’ are threshold adjusted images of acta2-EGFP expression. G) Quantification of acta2 positive cell number on VA and PAAs, within area outlined in A and B. Number of acta2 positive cells is significantly reduced in K02288 treated embryos as compared to DMSO control. There is no significant decrease in miR26a knockdown embryos (two Way ANOVA, N = 3, miR26a MO n = 15, Wildtype n = 15, Unpaired t test, ****p< 0.0001 as compared to control, Error Bars = SEM. H) Quantification of length of VA, within area outlined in A and B. Length of VA is significantly reduced in K02288 treated embryos as compared to DMSO control. There is no significant decrease in miR26a knockdown embryos (Two Way ANOVA, N = 3, miR26a MO n = 15, Scr.Control n = 15, Unpaired t test, ****p< 0.0001 as compared to control, Error Bars = SEM. VA = ventral aorta, HA = hyoid artery, BA = bulbous arteriosus. (N = 3, 8–9 embryos per treatment group. One Way ANOVA, p< 0.001–0.0001***-****. Scale bar represents 50μm. I-L) pSmad1/59 staining in K02288 treated embryos. Endothelial nuclei (fli1a:nEGFP; I-L, arrowheads) and pSmad1/5/9 (pSmad1, white I’-L’) and overlay (magenta, I”-L”) in 4 dpf Scr. Control and miR26a morphants. Solid yellow arrowheads in I”-L” indicate pSmad1 + fli1a:nEGFP double positive nuclei in the ventral aorta. M) Quantification of total number of fli1a:nEGFP nuclei in the ventral aorta. N) Quantification of the percent pSmad1; fli1a:nEGFP double positive nuclei in miR26a morphants and miR26a CRISPRi embryos. N = 3 experiments, total embryos Scr. Control MO n = 9, miR26a MO n = 9. One Way ANOVA, p< 0.001–0.0001***-****. Scale bar represents 50μm.
|