IMAGE

Fig 6

ID
ZDB-IMAGE-191230-1164
Source
Figures for Watterston et al., 2019
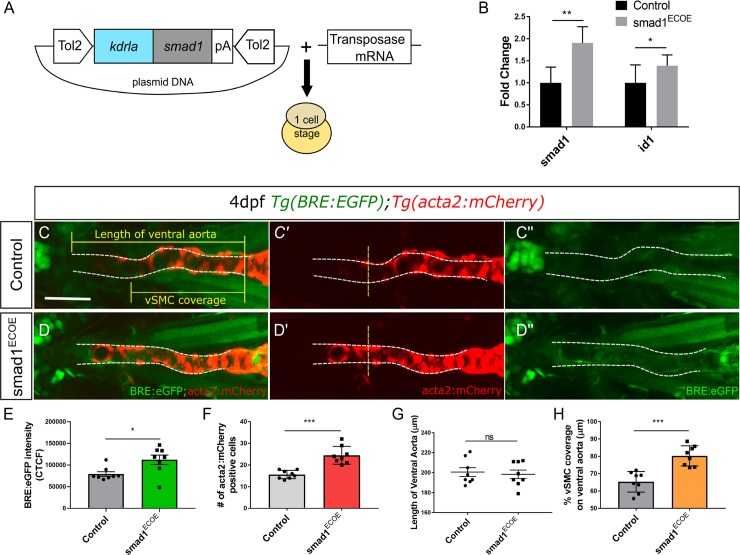
Image
Figure Caption

Fig 6 <italic>smad1</italic> overexpression in endothelial cells results in increased vSMC coverage.

A) Vector construct for overexpression of smad1 under the endothelial cell promoter kdrla. B) RT-qPCR fold change in smad1 and id-1 expression levels in endothelial specific smad1 overexpressing embryos (smad1ECOE) embryos at 4 dpf (n = 3). RT-qPCR data show the mean ± SEM, Student's two-tailed t-test *p < 0.05, n, number of biological replicates. C–D) Representative orthogonal projections of ventral views of 4 dpf Tg(BRE:EGFP); Tg(acta2:mCherry) embryos. Control embryos (C-C”) and smad1ECOE embryos (D-D”) showing endothelial BRE:EGFP and vSMC acta2:mCherry expression in the ventral aorta (VA) and pharyngeal arch arteries (PAA). E) Quantification of green fluorescent marker (BRE:EGFP) along the VA, highlighted within the yellow region in C” and D”, as corrected total cell fluorescence (CTCF). F) Quantification of acta2 positive cell number on VA, within area outlined in C and D. Number of acta2 positive cells is significantly increased in smad1ECOE embryos. G) Quantification of length of VA, within area outlined in C and D. H) Quantification of the percent vSMC coverage of ventral aorta. For each quantification, N = 3, smad1ECOE embryos n = 8, Control n = 8, Student's two-tailed t-test, *-***p< 0.01–0.0001 as compared to control. Error bars = SEM, Scale bar represents 50μm.

Figure Data
Acknowledgments
This image is the copyrighted work of the attributed author or publisher, and ZFIN has permission only to display this image to its users. Additional permissions should be obtained from the applicable author or publisher of the image. Full text @ PLoS Genet.