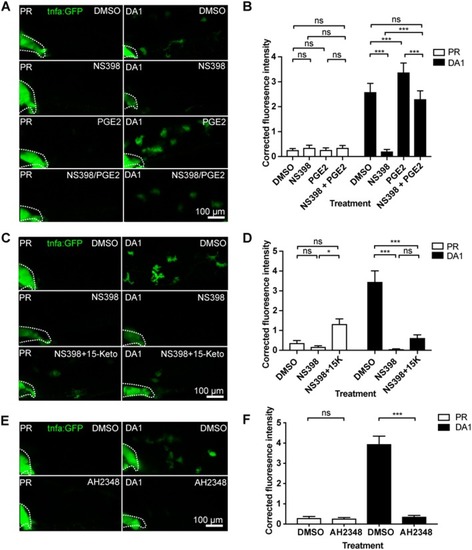
Hif-1α-induced tnfa:GFP requires active prostaglandin E2. (A) Confocal micrographs of 1 dpi caudal vein region in the TgBAC(tnfa:GFP)pd1028 line. Phenol red (PR) and dominant active Hif-1α (DA1) injected larvae were treated with DMSO or NS398 (Cox-2 inhibitor) in the presence or absence of endogenous prostaglandin E2 (PGE2). All larvae are PVP injected. (B) Corrected fluorescence intensity levels of tnfa:GFP in larvae in (A). Mean ± SEM, n = 54 cells from nine embryos accumulated from three independent experiments. P-values shown are: *P < 0.05, **P < 0.01, and ***P < 0.001, two way ANOVA with Bonferonni post-test adjustment. (C) Confocal micrographs of 1 dpi caudal vein region in the TgBAC(tnfa:GFP)pd1028 transgenic line. Phenol red (PR) and dominant active Hif-1α (DA1) injected larvae were treated with DMSO or NS398 (Cox-2 inhibitor) in the presence or absence of endogenous 15-keto prostaglandin E2 (15K). All larvae are PVP injected. P-values shown are: *P < 0.05, **P < 0.01, and ***P < 0.001, two way ANOVA with Bonferonni post-test adjustment. (D) Corrected fluorescence intensity levels of tnfa:GFP in larvae in (C). Mean ± SEM, n = 24 cells from four embryos accumulated from two independent experiments. (E) Confocal micrographs of 1 dpi caudal vein region in the TgBAC(tnfa:GFP)pd1028 transgenic line. Phenol red (PR) and dominant active Hif-1α (DA1) injected larvae were treated with DMSO or AH2348 (EP4 inhibitor). All larvae are PVP injected. (F) Corrected fluorescence intensity levels of tnfa:GFP in larvae in (E). Mean ± SEM, n = 72 cells from 12 embryos accumulated from three independent experiments. P-values shown are: *P < 0.05, **P < 0.01, and ***P < 0.001, two way ANOVA with Bonferonni post-test adjustment.
|
