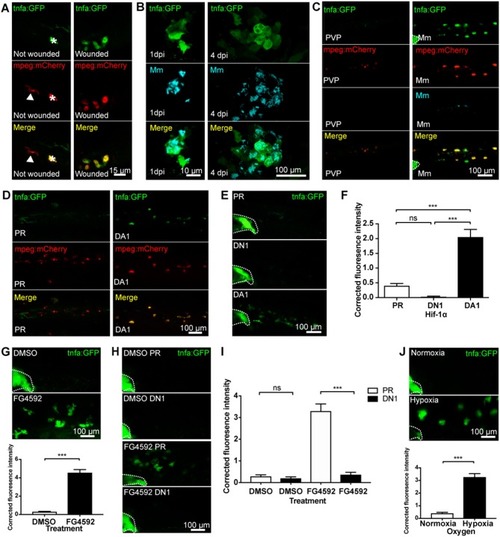
Macrophage tnfa:GFP is upregulated by injury, Mm infection and Hif-1α stabilization. (A) Confocal micrographs of 3 days post-fertilization larvae with or without tailfin wound (16 hpw) at the tailfin site. tnfa expression was detected using the TgBAC(tnfa:GFP)pd1028 transgenic line. Macrophages are shown in red using a Tg(mpeg1:mCherryCAAX)sh378 line. The white arrowhead indicates the presence of a tnfa:GFP negative, mpeg:mCherry positive macrophage in the tailfin of a non-wounded control. Asterisk indicates a neuromast that is fluorescent in all channels as a marker of position. Representative images of three independent experiments with 20–30 larvae per group per experiment. (B) Confocal micrographs of 1 dpi Mm mCrimson infected larvae, prior to granuloma formation (left panels), and 4 dpi, early granuloma (right panels) stages of infection using the TgBAC(tnfa:GFP)pd1028 line. Representative images of three independent experiments with 20–30 larvae per group per experiment. (C) Confocal micrographs of 1 day post-infection (dpi) with Mm mCrimson at the caudal vein region of infection in the TgBAC(tnfa:GFP)pd1028 line. Macrophages are shown in red using a Tg(mpeg1:mCherryCAAX)sh378 line. Mm in right panels with PVP control in left panels. a Dotted lines indicate the yolk extension of the larvae where there is non-specific fluorescence. Representative images of three independent experiments with 20–30 larvae per group per experiment. (D) Confocal micrographs of 2 dpf larvae in the caudal vein region in the TgBAC(tnfa:GFP)pd1028 line. Macrophages are shown in red using a Tg(mpeg1:mCherryCAAX)sh378 line. Larvae were injected at the 1 cell stage with dominant active (DA) Hif-1α or phenol red (PR) control. Representative images of three independent experiments with 20–30 larvae per group per experiment. (E) Confocal micrographs of 2 dpf zebrafish imaged around the caudal vein region in the TgBAC(tnfa:GFP)pd1028 line. Larvae were injected at the 1 cell stage with dominant negative (DN) or dominant active (DA) Hif-1α or phenol red (PR) control. (F) Corrected fluorescence intensity levels of tnfa:GFP in larvae in (E). Mean ± SEM, n = 66 cells from 12 embryos accumulated from three independent experiments and corresponds to images in (E). P-values shown are: *P < 0.05, **P < 0.01, and ***P < 0.001, one way ANOVA with Bonferonni post-test adjustment. (G) Confocal micrographs of 2 dpf TgBAC(tnfa:GFP)pd1028 larvae treated with the PHD inhibitor FG4592 or a DMSO solvent control. Graph shows corrected fluorescence intensity levels of tnfa:GFP. Mean ± SEM, n = 54 cells from nine embryos accumulated from three independent experiments. P-values shown are: *P < 0.05, **P < 0.01, and ***P < 0.001, unpaired, two-tailed t-test. (H) Confocal micrographs of 2 dpf TgBAC(tnfa:GFP)pd1028 larvae treated with the PHD inhibitor FG4592 or a DMSO solvent control. Larvae were injected at the 1 cell stage with dominant negative (DN) Hif-1α or phenol red (PR) control. (I) Corrected fluorescence intensity levels of tnfa:GFP in larvae in (H). Mean ± SEM, n = 60 cells from 10 embryos accumulated from three independent experiments. P-values shown are: *P < 0.05, **P < 0.01, and ***P < 0.001, two way ANOVA with Bonferonni post-test adjustment. (J) Confocal micrographs of 2 dpf TgBAC(tnfa:GFP)pd1028 larvae incubated in room normoxia or 5% oxygen (hypoxia) for 6 h between 32 and 38 hpf. Graph shows corrected fluorescence intensity levels of tnfa:GFP. Mean ± SEM, n = 72 cells from 12 embryos accumulated from three independent experiments. P-values shown are: *P < 0.05, **P < 0.01, and ***P < 0.001, unpaired, two-tailed t-test.
|
