
- Title
-
Hypoxia Induces Macrophage tnfa Expression via Cyclooxygenase and Prostaglandin E2 in vivo
- Authors
- Lewis, A., Elks, P.M.
- Source
- Full text @ Front Immunol
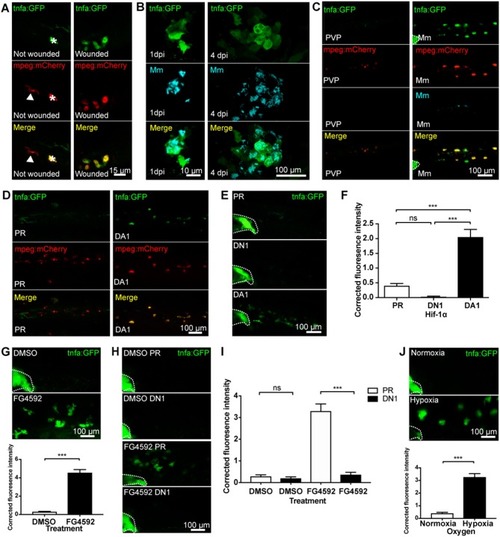
Macrophage |
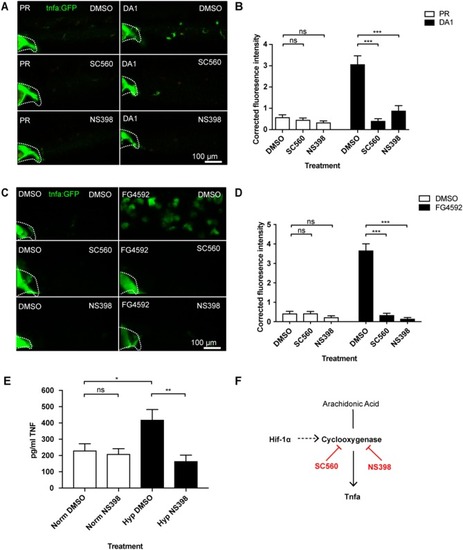
Hif-1α-activated |

Injury and infection induced |

Blocking 15-lipoxygenase or leukotriene B4 receptors does not abrogate DA-Hif-1α-upregulation of |
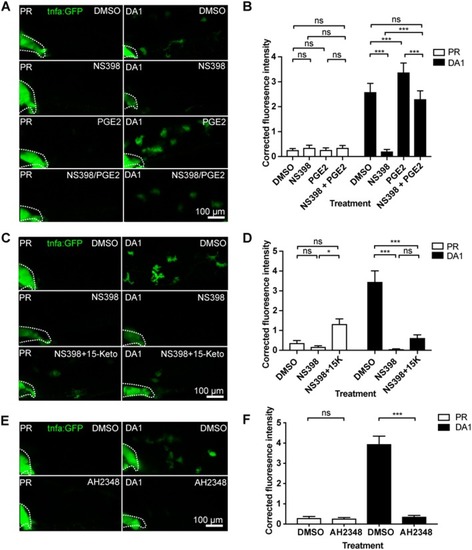
Hif-1α-induced |