
Fig. S3
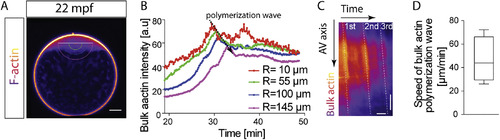
Speed Analysis of Bulk F-Actin Polymerization Wave, Related to Figure 2 (A) Fluorescence image of an oocyte expressing Utr-GFP to mark F-actin. Semi-circles indicate the ROIs used for measuring the actin intensity in different distances from the center of the wave. Scale bar, 100 μm. (B) Averaged actin intensity for different distances from the wave center using the semi-circular ROIs as indicated in (A) for the duration of the first cycle (0-50 mpf). The dashed black arrow marks the maxima of each curve, indicating polymerization wave propagation. (C) Kymograph of actin movement along the animal-vegetal (AV) axis of the oocyte as a function of time. White dashed lines trace the bulk actin polymerization waves during the first 3 cleavages. Scale bars, 25 μm (y axis) and 10 min (x axis). (D) Speed of the actin polymerization wave. Box and whiskers, min to max. N = 4 experiments, n = 4 oocytes. |
Reprinted from Cell, 177(6), Shamipour, S., Kardos, R., Xue, S.L., Hof, B., Hannezo, E., Heisenberg, C.P., Bulk Actin Dynamics Drive Phase Segregation in Zebrafish Oocytes, 1463-1479.e18, Copyright (2019) with permission from Elsevier. Full text @ Cell