Figure 2 - figure supplement 1

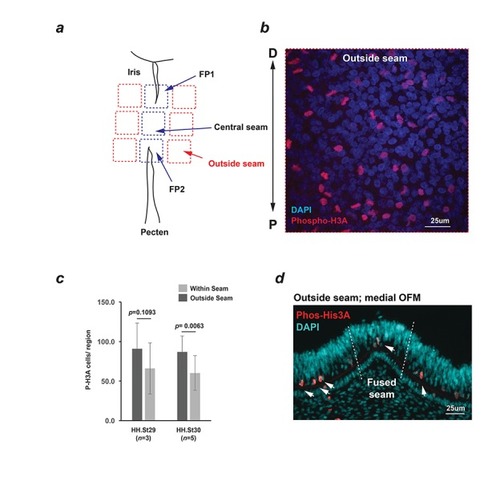
Analysis of proliferation in the OF margin.

(a) Schema for quantifying Phospho-Histone H3A foci within confocal Z-stacks taken of whole mounted fissures using a region of interest grid system. (b) Representative image showing positive nuclei (red). ROI grids used were 200 × 200 μm; all positive foci were recorded. P-D axis is shown for (a) and (b). (c) Quantified Phospho-Histone H3A immunostaining of whole-mounted fissures. Fewer proliferating cells (p=0.1093) were observed at HH.St29 within the seam (mean = 66.0, SD = 20.30) compared to outside the seam (mean = 90.8, SD = 32.6), and at HH.St30 (p=0.0063; mean fused seam = 86.8, SD = 32.3; within seam mean = 60.2, SD = 21.8); Student’s t-test used to compare within and outside seam. Data shown are the mean of three fissures per stage with standard deviations indicated. Note: Central seam length was too small to quantify in HH.St29 fissures (<200 μm), however phospho-Histone H3A foci were fewer at the fusion points compared to non-seam regions. (d) Representative phospho-Histone H3A immunostaining of serially-sectioned fissures at HH.St29 revealed the presence of mitotic cells within the apical neural retina throughout the ventral eye. Phospho-Histone H3A was not enriched in the fused seam (HH.St30; n = 3).

Expression Data

Expression Detail
Antibody Labeling
Phenotype Data

Phenotype Detail
Acknowledgments
This image is the copyrighted work of the attributed author or publisher, and ZFIN has permission only to display this image to its users. Additional permissions should be obtained from the applicable author or publisher of the image. Full text @ Elife