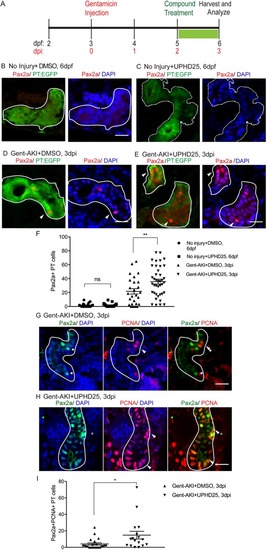
UPHD25 treatment increases Pax2a reactivation and proliferation during AKI. (A) Experiment schematic: Tg(PT:EGFP) larvae were injected with gentamicin at 3 dpf to induce AKI (gent-AKI). At 2 dpi, gent-AKI larvae were treated with 1% DMSO or 1 μM UPHD25 for 24 h (2-3 dpi) then harvested for analysis. (B-E) Immunofluorescence staining of Pax2a (red), proximal tubule (PT; green) and nuclei (DAPI; blue) of age-matched 6 dpf no injury+DMSO (B), 6 dpf no injury+UPHD25 (C), 3 dpi gent-AKI+DMSO (D) and 3 dpi gent-AKI+UPHD25 (E) larvae. Nuclear localization of Pax2a was shown by overlaying with nuclear counterstain, DAPI (blue). PT is outlined in white and Pax2a+ RTECs are marked with arrowheads. (F) Quantification of Pax2a+ cells. MeanNoInjury+DMSO=1.561 (N= 26) vs MeanNoInjury+UPHD25=1.787 (N=21) vs MeanGent-AKI+DMSO=21.8 (N=26) vs MeanGent-AKI+UPHD25=35.79 (N=40). Data pooled from three biological replicates are shown expressed as mean±s.e.m. One-way ANOVA. (G,H) Immunofluorescence co-stain of Pax2a (green), PCNA (red) and DAPI (blue) in gent-AKI+DMSO (G) and gent-AKI+UPHD25 (H). Nuclear localization of PCNA was shown by overlaying with nuclear counterstain, DAPI (blue). Pax2a+ cells are marked with asterisks and PCNA+ are marked with arrowheads. (I) Quantification of Pax2a+ PCNA+ cells. MeanGent-AKI+UPHD25=4.08 (N=23) vs MeanGent-AKI+UPHD25=14.74 (N=17). Data pooled from three biological replicates are shown expressed as mean±s.e.m. Two-tailed t-test: *P<0.05, **P<0.01, ns, not significant. Scale bars: 20 μm.
|
