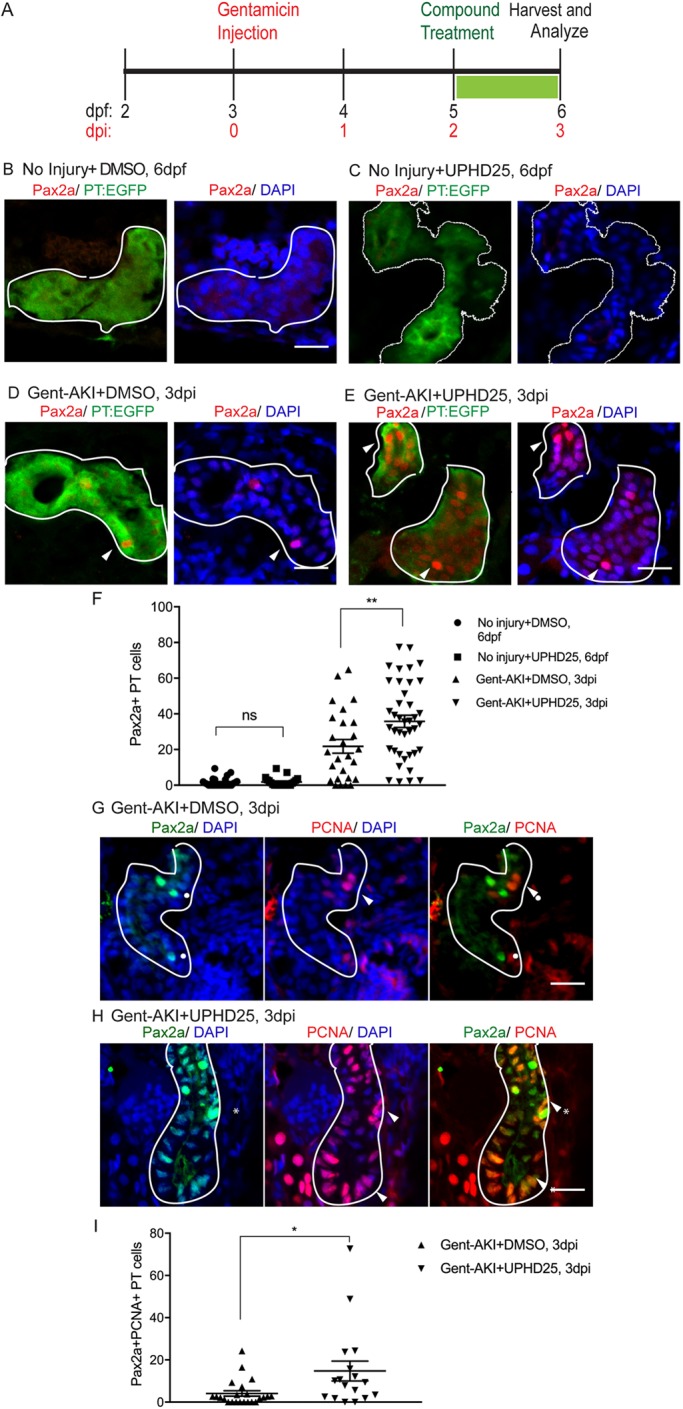
UPHD25 treatment increases Pax2a reactivation and proliferation during AKI. (A) Experiment schematic: Tg(PT:EGFP) larvae were injected with gentamicin at 3 dpf to induce AKI (gent-AKI). At 2 dpi, gent-AKI larvae were treated with 1% DMSO or 1 μM UPHD25 for 24 h (2-3 dpi) then harvested for analysis. (B-E) Immunofluorescence staining of Pax2a (red), proximal tubule (PT; green) and nuclei (DAPI; blue) of age-matched 6 dpf no injury+DMSO (B), 6 dpf no injury+UPHD25 (C), 3 dpi gent-AKI+DMSO (D) and 3 dpi gent-AKI+UPHD25 (E) larvae. Nuclear localization of Pax2a was shown by overlaying with nuclear counterstain, DAPI (blue). PT is outlined in white and Pax2a+ RTECs are marked with arrowheads. (F) Quantification of Pax2a+ cells. MeanNoInjury+DMSO=1.561 (N= 26) vs MeanNoInjury+UPHD25=1.787 (N=21) vs MeanGent-AKI+DMSO=21.8 (N=26) vs MeanGent-AKI+UPHD25=35.79 (N=40). Data pooled from three biological replicates are shown expressed as mean±s.e.m. One-way ANOVA. (G,H) Immunofluorescence co-stain of Pax2a (green), PCNA (red) and DAPI (blue) in gent-AKI+DMSO (G) and gent-AKI+UPHD25 (H). Nuclear localization of PCNA was shown by overlaying with nuclear counterstain, DAPI (blue). Pax2a+ cells are marked with asterisks and PCNA+ are marked with arrowheads. (I) Quantification of Pax2a+ PCNA+ cells. MeanGent-AKI+UPHD25=4.08 (N=23) vs MeanGent-AKI+UPHD25=14.74 (N=17). Data pooled from three biological replicates are shown expressed as mean±s.e.m. Two-tailed t-test: *P<0.05, **P<0.01, ns, not significant. Scale bars: 20 μm.
This image is the copyrighted work of the attributed author or publisher, and
ZFIN has permission only to display this image to its users.
Additional permissions should be obtained from the applicable author or publisher of the image.
Full text @ Dis. Model. Mech.
Your Input Welcome
Thank you for submitting comments. Your input has been emailed to ZFIN curators who may contact you if
additional information is required.
Oops. Something went wrong. Please try again later.