
FIGURE
Fig. 8
- ID
- ZDB-FIG-190701-17
- Publication
- Liu et al., 2019 - Imaging neural events in zebrafish larvae with linear structured illumination light sheet fluorescence microscopy
- Other Figures
- All Figure Page
- Back to All Figure Page
Fig. 8
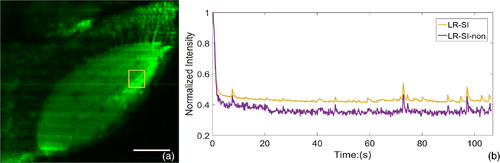
LR-SI image of a 7-day-old elavl3:GCaMP5g; gad1b:RFP; mitfaw2/w2 zebrafish larva treated with 15 mM PTZ. (a) Integration of the intensity at the location of the RoI is calculated. (b) Intensity change of the RoI noted in (a) plotted as a function of time. LR-SI-non shows higher peak signals relative to the background compared to LR-SI. However, the LR-SI-non results in lower SNRs relative to LR-SI method. The scale bar is 40 μm.
|
Expression Data
Expression Detail
Antibody Labeling
Phenotype Data
Phenotype Detail
Acknowledgments
This image is the copyrighted work of the attributed author or publisher, and
ZFIN has permission only to display this image to its users.
Additional permissions should be obtained from the applicable author or publisher of the image.
Full text @ Neurophotonics