
FIGURE
Fig. 5
- ID
- ZDB-FIG-190701-15
- Publication
- Liu et al., 2019 - Imaging neural events in zebrafish larvae with linear structured illumination light sheet fluorescence microscopy
- Other Figures
- All Figure Page
- Back to All Figure Page
Fig. 5
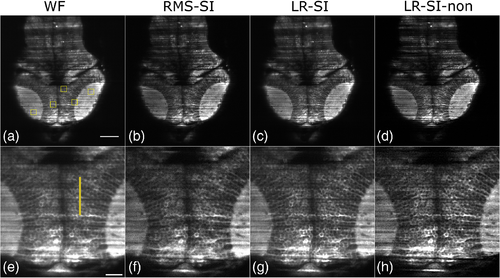
Maximum intensity projections of 7-day-old elavl3:GCaMP5g; gad1b:RFP; mitfaw2/w2 zebrafish larva. (a)–(d) WF, RMS-SI, LR-SI, and LR-SI-non reconstructed images of the red channel of zebrafish larva’s central nervous system, respectively. WF and RMS images are scaled up 2× bicubicly to match the pixel count of the LR-SI method. The image size is 500×500 μm2 and scale bar shown in (a) is 75 μm. (e)–(h) 183.4×183.4 μm2 cutouts from (a)–(d) and the scale bar shown in (e) is 25 μm. The yellow line indicates the position of the cross-sections in Fig. 6.
|
Expression Data
Expression Detail
Antibody Labeling
Phenotype Data
Phenotype Detail
Acknowledgments
This image is the copyrighted work of the attributed author or publisher, and
ZFIN has permission only to display this image to its users.
Additional permissions should be obtained from the applicable author or publisher of the image.
Full text @ Neurophotonics