
Fig. 5
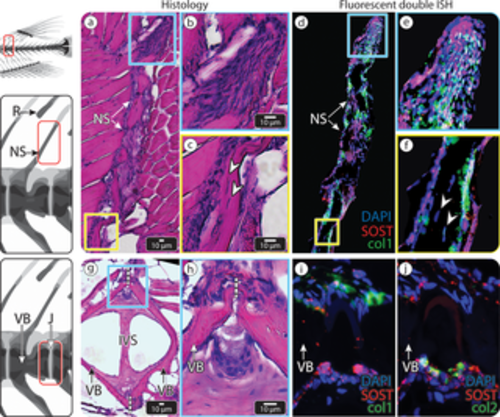
SOST expression in zebrafish vertebra. (a–f) An NS of zebrafish vertebra. (a) HE-stained section. The blue and yellow squares mark distal and proximal regions within the NS, respectively, shown at higher magnification in (b) and (c), respectively. (b) Higher magnification of the tip of the spine. (c) Higher magnification of the spine, showing osteocytes residing inside the bone material (white arrowheads). (d) Double fluorescent ISH showing both Col1a1 (green) and SOST (red) expression in surface cells of the NS, indicating they are SOST-positive osteoblasts. The blue and yellow squares correspond to the regions (b) and (c) in (a) and to (e) and (f). (e) The tip of the spine contains numerous SOST-positive osteoblasts and seems to serve as an active growth region. (f) Osteocytes (white arrowheads) do not appear to express SOST. (g–j) The IVR in the caudal vertebral column of zebrafish, (g) HE-stained sagittal section. Dashed white lines mark the border between one vertebra to another. The blue square marks the intravertebral region shown in (h–j) at higher magnification. (h) Magnification of the IVR, showing the J between 2 adjacent VBs and their distinct cell populations. (i) Double fluorescent ISH (SOST and Col1a1) identifies the upper cell population in (h) as osteoblasts since they express Col1a1a (green) and shows both the upper and lower cell populations to express SOST. (j) Double fluorescent ISH (SOST and Col2a1) shows the lower population of cells to be chordoblasts, based on their distinctive morphology location and expression of Col2a1(green). These cells also express SOST (red). Scale bars apply to all images of comparable regions (i.e., b and e; c and f; h, i, and j). Results for individual stains (e.g. DAPI, SOST, col1, col2) are shown in S5 Fig. Col1a1, collagen type I alpha 1; Col2a1, collagen type II alpha 1; HE, hematoxylin–eosin; ISH, in situ hybridization; IVR, intervertebral region; IVS, intervertebral space; J, joint; NS, neural spine; R, radial; VB, vertebral bone. |
| Genes: | |
|---|---|
| Fish: | |
| Anatomical Terms: | |
| Stage: | Adult |