
Fig. 5
- ID
- ZDB-FIG-181024-23
- Publication
- Swaminathan et al., 2018 - Non-canonical mTOR-Independent Role of DEPDC5 in Regulating GABAergic Network Development
- Other Figures
- All Figure Page
- Back to All Figure Page
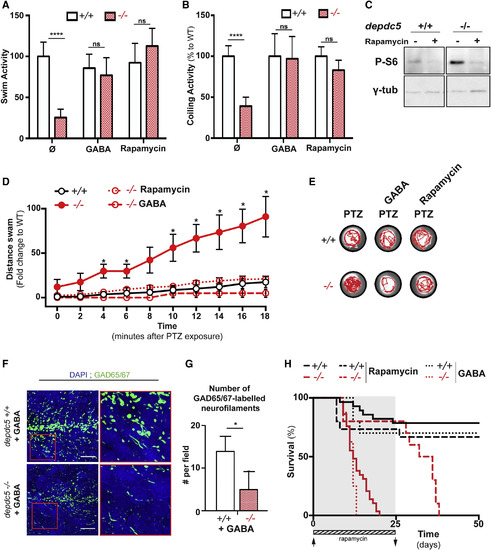
Rescuing Effect of GABA and Rapamycin on depdc5 Knockout Zebrafish (A) Swimming activity of 8-dpf larvae, with the activity of depdc5+/+ larvae normalized to 100%, shows that treatment with GABA (100 μM) can completely rescue hypoactivity; N = 2, n = 20/genotype/treatment. Rapamycin treatment (100 nM from day 0 to 2, 300 nM from day 3 onward) was used as a positive control. (B) Spontaneous coiling activity in 20-hpf embryos shows that the hypoactivity of depdc5−/− embryos is rescued by treating with 100 nM rapamycin or with 100 μM GABA from the single-cell stage. N = 2, n = 20/genotype/treatment; Student’s t test, ∗∗∗∗p(control WT versus HM) < 0.0001. Coiling activity of depdc5+/+ was set at 100% for each sample, and the relative activity of the depdc5−/− larvae is represented. (C) Western blotting of 9-dpf larval lysates to examine phospho-S6 levels in depdc5+/+ and depdc5−/− larvae treated with DMSO or rapamycin (100 nM from day 0 to 2, 300 nM from day 3 onward) shows inhibition of mTOR signaling upon rapamycin treatment. (D) Distance swam by 2-dpf larvae treated with GABA (100 μM) or rapamycin (100 nM) upon PTZ exposure (3 mM). N = 3, n > 10. (E) Representative swimming tracks of 2-dpf embryos (untreated or treated with GABA or rapamycin) during a 10-min period following PTZ exposure (3 mM). (F) Images of transverse sections of 7-dpf GABA-treated depdc5+/+ and depc5−/− larval brains immunostained with α-GAD65/67 and counterstained with DAPI. Regions indicated in red boxes have been magnified to show the branching defects. GABA treatment (100 μM) was begun at 8 hpf; n = 3 embryos/genotype. Scale bar, 10 μm. (G) Quantification of the number of GAD65/67-positive neurofilaments in GABA-treated depdc5+/+ and −/− larval brain sections showing that GABA treatment does not rescue the defects in depdc5−/−. (H) Survival curve showing that treatment of depdc5−/− larvae with rapamycin (100 nM from day 0 to 2, 300 nM from day 3 onward) first prolongs lifespan as long as rapamycin is supplemented in the water (until day 25; shaded). Withdrawal of rapamycin results in a drop in survival, and all the larvae die by day 35. On the contrary, treatment with 100 μM GABA from 8 hpf does not extend survival. Neither rapamycin nor GABA affected depdc5+/+. |
| Antibodies: | |
|---|---|
| Fish: | |
| Conditions: | |
| Anatomical Terms: | |
| Stage: | Days 7-13 |
| Fish: | |
|---|---|
| Conditions: | |
| Observed In: | |
| Stage Range: | 20-25 somites to Days 21-29 |