
Fig. S2
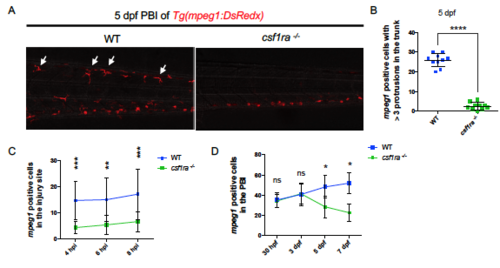
Csf1ra Mutants Show General Deficiencies in Peripheral Macrophages. Related to Figure 2. (A and B) Representative images showing the peripheral macrophages (A) and quantification (B) of mature ramified macrophages with at least 3 protrusions (arrows) in the trunk region of 5 dpf WT or csf1ra-/- embryos. Macrophages were labeled by Tg(mpeg1:DsRedx) (red). n = 10 for each group. Values represent means with SD. (C) Injuries were performed in the tail fins of 2 dpf WT Tg(mpeg1:DsRedx) (n = 10) or csf1ra-/-; Tg(mpeg1:DsRedx) embryos (n = 13), and responding DsRedx+ macrophages were quantified in the injury site at 4 hours post injury (hpi), 6 hpi and 8 hpi, respectively. Values represent means ± SD. (D) Quantification of DsRedx+ macrophages in the PBI region of 30 hpf, 3 dpf, 5dpf and 7dpf WT Tg(mpeg1:DsRedx) or csf1ra-/-; Tg(mpeg1:DsRedx) embryos. n ranges from 6 to 16 for each group. Values represent means ± SD. ns, P>0.05; *, P ≤ 0.05; **, P ≤ 0.01; ***, P ≤ 0.001; ****, P ≤ 0.0001. |
| Fish: | |
|---|---|
| Observed In: | |
| Stage: | Day 5 |
Reprinted from Developmental Cell, 46, Wu, S., Xue, R., Hassan, S., Nguyen, T.M.L., Wang, T., Pan, H., Xu, J., Liu, Q., Zhang, W., Wen, Z., Il34-Csf1r Pathway Regulates the Migration and Colonization of Microglial Precursors, 552-563.e4, Copyright (2018) with permission from Elsevier. Full text @ Dev. Cell