
Fig. 4
- ID
- ZDB-FIG-180927-51
- Publication
- Deán-Ben et al., 2016 - Functional optoacoustic neuro-tomography for scalable whole-brain monitoring of calcium indicators
- Other Figures
- All Figure Page
- Back to All Figure Page
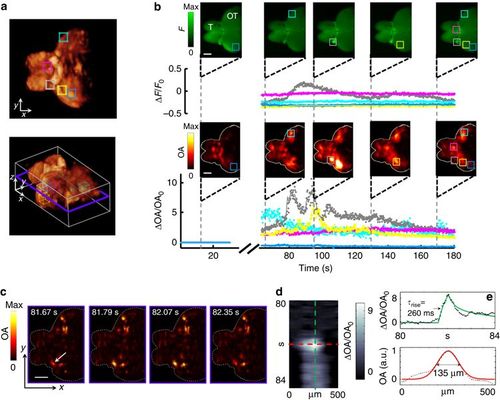
Monitoring activity in isolated scattering adult brains. (a) Typical 3D optoacoustic image acquired from a highly scattering brain of an adult fish in its resting state (two side views and one isometric view of the 3D reconstruction are shown). The telencephalon (T) and most of the optic tectum (OT) are clearly visible. Five 0.3 × 0.3 × 0.3 mm3 VOIs were chosen at different locations and depths within the brain. (b) Traces of the fluorescence (top) and optoacoustic (bottom) signal changes recorded at 25 frames per second are shown for the five regions in corresponding colors (all signal changes are normalized to the resting signal levels). Note that the optoacoustic traces are calculated over volumes, whereas the fluorescent signals are calculated over the roughly corresponding planar areas. Snapshot images (not normalized) acquired at five different time points before and after introduction of the neurostimulant are further shown (scale bar=500 μm). The volumetric optoacoustic images are shown here as maximum intensity projections along the z axis. The injection phase caused image artifacts and is therefore excluded from the graphs. (c) Time-resolved images from a single (unaveraged) slice through the 3D optoacoustic data. Approximate location of the slice is indicated by a blue frame in a. (d) Close-up spatiotemporal resolution analysis of a single line (orientation of the line is shown by an arrow in c). (e) Temporal and spatial profiles through the image in d, revealing characteristic optoacoustic signal constants of 260 ms and 135 μm, respectively. Solid green and red lines correspond to fits through the individual data points. |