
Fig. 2
- ID
- ZDB-FIG-180927-49
- Publication
- Deán-Ben et al., 2016 - Functional optoacoustic neuro-tomography for scalable whole-brain monitoring of calcium indicators
- Other Figures
- All Figure Page
- Back to All Figure Page
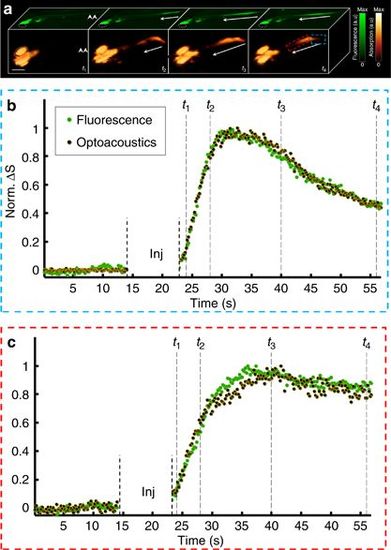
Imaging of neuronal activation in HuC:GCAMP5g zebrafish larvae. (a) Planar epifluorescence (green) and 3D optoacoustic (absorption contrast, orange) images of a 6-day-old larvae at four time points after injection of neurostimulant show a similar dynamics of the signals (scale bar=500 μm). The arrows show direction of the activation as it progresses from the posterior (site of injection marked by a double arrow in the left frame) to the anterior part of the tail. Eyes are marked with a dotted line. (b) Traces of the fluorescence and optoacoustic signals recorded at 25 frames per second show calcium dynamics in the posterior region of the spinal cord (marked by red rectangle in a). (c) Corresponding traces in the anterior region (marked by the blue rectangle). The time points shown in a are marked by vertical dotted lines. Since both the background fluorescence and optoacoustic signals were close or below the noise level, the changes in the signals (ΔS) were normalized to unity instead of being divided by the respective resting signals. The injection phase caused image artifacts and is therefore excluded from the graphs. |