
FIGURE
Fig. 3
- ID
- ZDB-FIG-180927-50
- Publication
- Deán-Ben et al., 2016 - Functional optoacoustic neuro-tomography for scalable whole-brain monitoring of calcium indicators
- Other Figures
- All Figure Page
- Back to All Figure Page
Fig. 3
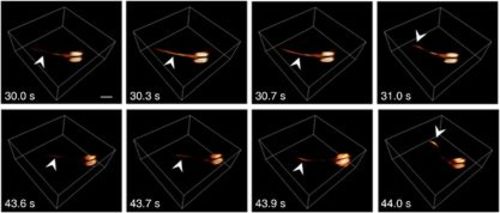
Activation in freely swimming larvae. Two separate activation events, as captured by volumetric optoacoustic tomography, are shown. Following injection of the neurostimulating agent at approximately t=0, the larva occasionally stops swimming while experiencing a surge of activation through its tail (the arrows point to the location of optoacoustic signal increase) before it starts moving promptly to a new position (notice movement of the tail in the two rightmost frames). Scale bar=500 μm. |
Expression Data
Expression Detail
Antibody Labeling
Phenotype Data
Phenotype Detail
Acknowledgments
This image is the copyrighted work of the attributed author or publisher, and
ZFIN has permission only to display this image to its users.
Additional permissions should be obtained from the applicable author or publisher of the image.
Full text @ Light Sci Appl