
Fig. 2-S1
- ID
- ZDB-FIG-180912-72
- Publication
- Aman et al., 2018 - Wnt/β-catenin regulates an ancient signaling network during zebrafish scale development
- Other Figures
- All Figure Page
- Back to All Figure Page
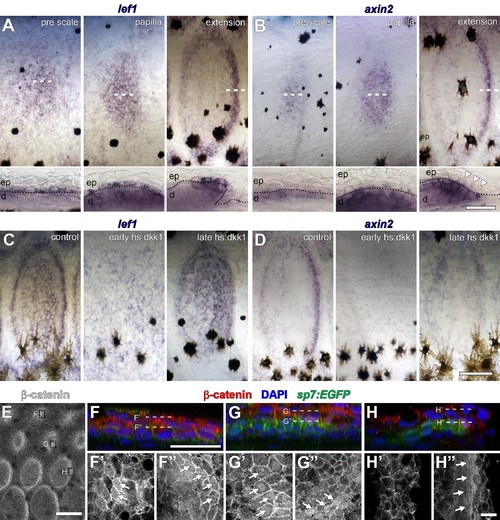
Distribution of Wnt/β-catenin signaling targets in developing scales. (A) lef1 was initially broadly expressed in cuboidal, basal epidermal cells prior to overt scale morphogenesis (pre scale; n = 6). Subsequently, expression spread to dermal cells of the scale papilla (papilla; n = 6) before becoming restricted to epidermal and dermal cells at the posterior margin (extension; n = 6). Dotted lines in lower panels indicate epidermal–dermal boundary. (B) axin2 was expressed in the dermis prior to scale formation (pre scale; n = 6). Expression persisted throughout the dermal papilla and weak expression was detected in epidermal cells (papilla; n = 6). axin2 expression ultimately became restricted to dermal cells at the posterior margin (extension) and was absent in overlying epidermal cells (arrowheads; n = 6). (C) Induction of hs:dkk1 prior to initial squamation (early hs:dkk1) prevented patterned expression of lef1 (n = 8). hs:dkk1 induction did not affect lef1 expression in scales that had formed prior to induction (late hs:dkk1; n = 8). (D) axin2 expression was abolished from skin when hs:dkk1 was induced prior to squamation (early hs:dkk1; n = 8) and from scales that had already formed prior to induction (late hs:dkk1; n = 8). (E) Whole-mount antibody staining revealed intense accumulation of β-catenin protein in early (sp7:EGFP negative) pre-scale regions (top box); polarized sp7:EGFP+ scale papillae (mid box) and extending scales (bottom box). (F) In pre scale regions, nuclear β-catenin (red) was detected in superficial epidermis (F’) as well as deep dermis (F’’) (arrows). (G) In sp7:EGFP+ (green) scale papilla, nuclear β-catenin was present in epidermis (G’) and in dermal sp7:EGFP+ scale forming cells (G’’, arrows). (H) In extending scales, nuclear β-catenin was not detected in epidermis (H’) but only in one to two rows of sp7:EGFP+ dermal scale forming cells at the posterior margin (H’, arrows). Scale bars, 250 µm (A–D, surface view); 50 µm (A–D, sections); 250 µm (E); 25 µm (F–H); 10 µm (F’–H’, F’–H’). |