
Fig. 1
- ID
- ZDB-FIG-180912-67
- Publication
- Aman et al., 2018 - Wnt/β-catenin regulates an ancient signaling network during zebrafish scale development
- Other Figures
- All Figure Page
- Back to All Figure Page
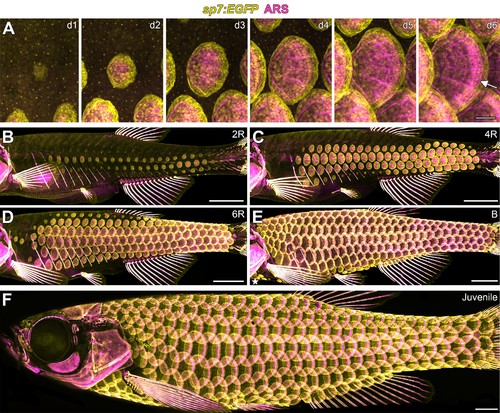
Zebrafish scale development. All images from a single representative individual labelled with sp7:EGFP (yellow, to visualize osteoblast-like scale forming cells) incubated with Alizarin Red-S vital dye (ARS, magenta, to visualize calcified matrix). (A) Development of a single, representative scale. A small cluster of dSFCs (d1) polarizes and grows posteriorly (d2–d5) until it imbricates with its neighbors and forms an intensely calcified limiting layer (arrow in d6). (B–E) Scales are added sequentially across the skin of larval fish. (B) Initially, two rows of scales form near the horizontal myoseptum, defined here as the 2R (two row) stage. (C) Additional dorsal and ventral rows arise, defining the 4R (four row) stage. (D) Row addition continues while columns of scales appear anterior and posterior, leading to the 6R (six row) stage. (E) In the B (beard) stage, a cluster of scales arises ventral–posterior to the head (star) and spreads along the ventrum. (F) Final squamation pattern in a juvenile. Scale bars, 200 µm (A); 1 mm (B–F). |
| Gene: | |
|---|---|
| Fish: | |
| Anatomical Terms: | |
| Stage Range: | Prim-5 to Days 21-29 |