
Fig. 1-S2
- ID
- ZDB-FIG-180801-16
- Publication
- LLeras Forero et al., 2018 - Segmentation of the zebrafish axial skeleton relies on notochord sheath cells and not on the segmentation clock
- Other Figures
- All Figure Page
- Back to All Figure Page
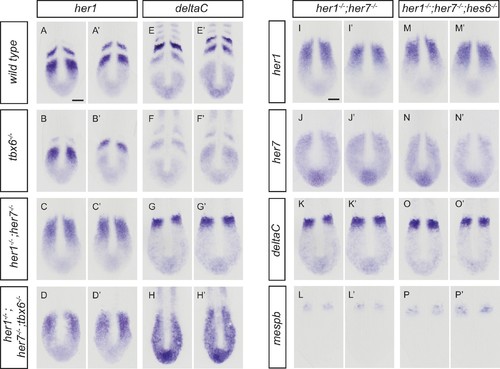
Disruption of the segmentation clock in tbx6, her1;her7, her1;her7;tbx6 and her1;her7;hes6 mutants. (A-H') In situ hybridization for segmentation clock markers her1 and deltaC in tbx6−/−, her1−/−;her7−/−and her1−/−;her7−/−;tbx6−/−. her1 (B and B’) and deltaC (F and F’) oscillate in the posterior PSM of tbx6−/−. her1 (C and C’) and deltaC (G and G’) do not oscillate in her1−/−;her7−/−. (D and D’, H and H’) her1 and deltaC do not oscillate and their expression is restricted to the posterior PSM in her1−/−;her7−/−;tbx6−/−. (I-P') Comparison of clock markers her1, her7 and deltaC and segmental output marker mespb between her1−/−;her7−/− and her1−/−;her7−/−;hes6−/−. her1, her7 and deltaC expression domains are indistinguishable in her1−/−;her7−/− (I and I’, J and J’, K and K’) and her1−/−;her7−/−;hes6−/− (M and M’, N and N’, O and O’). mespb expression in the anterior PSM is equivalently disordered in both mutants (L and L’, P and P’). Embryos are 13.5 hpf (10-somite stage). Scale bar in A applies to A-H’. Scale bar in I applies to I-P’. Scale bars are 100 µm. |