
Fig. S6
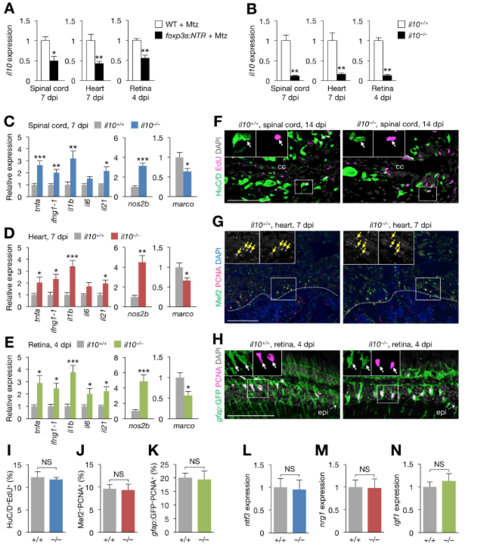
Regeneration phenotype of il10–/– zebrafish, Related to Figure 6. (A) il10 expression in injured spinal cords (left), hearts (middle), and retinas (right) from control and zTreg cell-depleted fish (mean ± SEM, n = 6). (B) il10 expression in injured spinal cords (left), hearts (middle), and retinas (right) from clutch mate WT (il10+/+) and il10–/– fish (mean ± SEM, n = 5). (C–E) qRT-PCR analysis of inflammatory cytokine (left) and M1 macrophage marker (middle) and M2 macrophage marker (right) gene expression in injured spinal cords (C), hearts (D), and retinas (E) from il10+/+ and il10–/– fish (mean ± SEM, n = 5). Gene expression is normalized to the levels in WT fish. (F–H) Proliferation of immature neurons (F; HuC/D+EdU+), cardiomyocytes (G; Mef2+PCNA+) and Müller glia (H; gfap:GFP+PCNA+) in injured spinal cords (F), hearts (G), and retinas (H) from il10+/+ and il10–/– fish. Insets show single-channel confocal slices (F, H) or epifluorescent images (G) of the demarcated regions. The rostral spinal cord stumps are shown in F. Arrows indicate co-labeled cells, and dotted lines indicate the wound border plane. (I–K) Quantification of F (I), G (J), and H (K). (mean ± SEM, n = 5). (L–N) qRT-PCR analysis of regeneration factor genes in injured spinal cords (L), hearts (M), and retinas (N) from il10+/+ and il10–/– fish (mean ± SEM, n = 5). cc, central canal; epi, injury epicenter. *P < 0.05, **P < 0.01, ***P < 0.001, Mann–Whitney U test. Scale bars, 100 μm. |
Reprinted from Developmental Cell, 43, Hui, S.P., Sheng, D.Z., Sugimoto, K., Gonzalez-Rajal, A., Nakagawa, S., Hesselson, D., Kikuchi, K., Zebrafish Regulatory T Cells Mediate Organ-Specific Regenerative Programs, 659-672.e5, Copyright (2017) with permission from Elsevier. Full text @ Dev. Cell