
Fig. s2
- ID
- ZDB-FIG-180323-15
- Publication
- Herbert et al., 2017 - Dynein/dynactin is necessary for anterograde transport of Mbp mRNA in oligodendrocytes and for myelination in vivo.
- Other Figures
- All Figure Page
- Back to All Figure Page
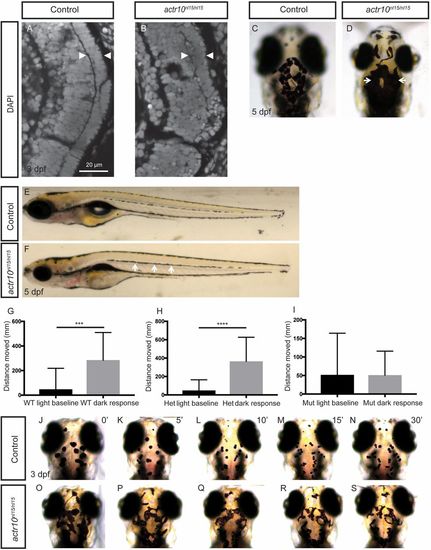
actr10nl15/nl15 mutants have similar phenotypes to dynactin and dynein mutants (related to Fig. 6). (A and B) Photoreceptor layer analysis by DAPI staining at 3 dpf. Controls (n = 4) have a normal photoreceptor layer (A, arrowheads), while actr10nl15/nl15 mutants (n = 3) have a disrupted photoreceptor layer (B, arrowheads). (C and D) Head pigment analysis at 5 dpf. WT controls have normal pigmentation (C), while actr10nl15/nl15 mutants have expanded pigment (D, arrows). (E and F) Lateral line pigment analysis at 5 dpf. WT control animals have intermittent pigment along the lateral line (E), while actr10nl15/nl15 mutants have increased pigment (F, arrows). (G–I) The Noldus DanioVision behavioral system was used to track larval movement at 6 dpf. WT (G, n = 23, ***P < 0.0002) and heterozygous (H, n = 36, ****P < 0.0001) controls showed a significant increase in movement in response to dark, while actr10nl15/nl15 mutants did not (I, n = 26, P < 0.98). An unpaired t test with Welch’s correction was used for statistical analysis. (J–S) Epinephrine treatment to assay retrograde melanosome transport. Before epinephrine treatment at 3 dpf, control animals (n = 19) exhibit similar pigment patterns. After 5 min of epinephrine exposure (K), melanosomes have begun to move back toward the melanophore cell body via retrograde transport. After 10 (L), 15 (M), and 30 min (N), all control animals have small pigment patches representative of aggregated melanosomes. Before epinephrine treatment, actr10nl15/nl15 mutants (n = 11) can be distinguished phenotypically from control animals by excessive pigment (O). After 5 (P), 10 (Q), 15 (R), and 30 (S) min of epinephrine treatment, melanosomes in mutants are still more dispersed relative to those in control animals. Note that representative animals were selected at random, and images may be different animals. (Magnification: C and D, 80×; E and F, 20×; J–S, 80×.) |