
Fig. 1
- ID
- ZDB-FIG-171108-19
- Publication
- Zhou et al., 2016 - Cardiac sodium channel regulator MOG1 regulates cardiac morphogenesis and rhythm
- Other Figures
- All Figure Page
- Back to All Figure Page
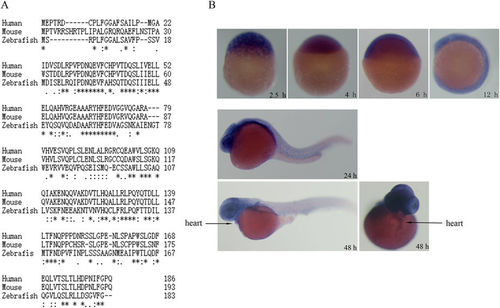
Identification of zebrafish mog1 gene and its expression profile. (A) Alignment of amino acid sequences of human MOG1 (GenBankTM accession number NP_057576), mouse Mog1 (GenBankTM accession number NP_001272370) and zebrafish Mog1 (GenBankTM accession number NP_001093465). (B) Whole-mount in situ hybridization analysis of zebrafish mog1 expression at different developmental stages during embryogenesis. Images for embryos at 2.5 hpf, 4 hpf, 6 hpf and 12 hpf are shown with lateral views with the animal pole to the top. Images for embryos at 24 hpf and 48 hpf stages are lateral views with the head to the left. A dorsal view of the 48 hpf embryo was also shown with the head to the top. |
| Gene: | |
|---|---|
| Fish: | |
| Anatomical Terms: | |
| Stage Range: | 256-cell to Long-pec |