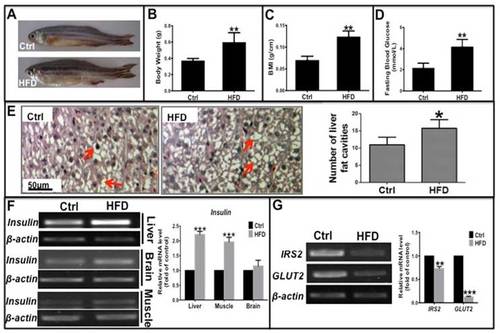
Long-term high-fat diet induced Type 2 Diabetes-like symptoms in zebrafish. Adult zebrafish were fed a normal diet (Ctrl) or a high-fat diet (HFD) for 10 weeks. (A)-(C) Comparison of morphology (A), body weight (B), and body mass index (BMI; weight/length, g/cm) (C) between Ctrl and HFD zebrafish. (D) Higher fasting blood glucose induced in the HFD group compared to the normal diet group. (E) Representative images of hematoxylin and eosin (H&E) staining show lipid vesicles in zebrafish liver slices in both groups. The histogram shows the average number of fat cavities per sight field in the control group and HFD group, which were counted from ten sight fields each group. (F) Representative electrophorogram of insulin bands from RT-PCR (left) and real-time qPCR results (right) show the mRNA levels of insulin gene transcription in the liver, brain, and muscle of zebrafish in both groups. (G) The mRNA levels of insulin receptor substrate-2 (IRS-2) and glucose transporter 2 (GLUT2) assayed by RT-PCR electrophorogram (left) and real-time qPCR results (right) in zebrafish liver. *p<0.05, **p<0.01, ***p<0.001 vs the control group.
|
