
Fig. 3
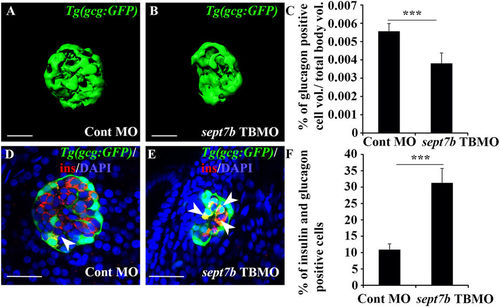
Knockdown of sept7b reduces α-cell volume and increases bihormonal cells positive for both insulin and glucagon. (A,B) Isosurface rendered z-stack confocal images generated from control MO-injected (A) and sept7b TBMO-injected (B) Tg(gcg:GFP) zebrafish larva at 4 dpf. Glucagon-positive α-cells are green. (C) Glucagon-positive cell volume is significantly reduced in sept7b TBMO-injected zebrafish larvae at 4 dpf. (D,E) Cells positive for both insulin (red) and glucagon (green) (bihormonal cells; arrowheads) are increased in sept7b TBMO-injected Tg(gcg:GFP) zebrafish larvae 4 dpf (E) compared to control MO-injected larva (D). In (D,E), nuclei are labeled with DAPI (blue). (F) Quantification of the percentage of bihormonal cells relative to insulin positive cells. Scale bar: (A,B) (25 μm); (D,E) (20 μm). Error bars represent mean ± SEM. ***p ≤ 0.0005. |
| Genes: | |
|---|---|
| Antibody: | |
| Fish: | |
| Knockdown Reagent: | |
| Anatomical Terms: | |
| Stage: | Day 4 |
| Fish: | |
|---|---|
| Knockdown Reagent: | |
| Observed In: | |
| Stage: | Day 4 |