
FIGURE
Fig. S3
Fig. S3
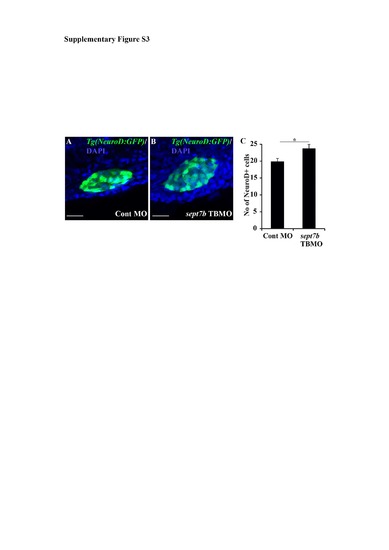
NeuroD-positive endocrine cells are increased in sept7b knockdown larvae. (A-B) NeuroD-positive cells (green) in control MOinjected (A) and sept7b TBMO-injected (B) Tg(neuroD:GFP) zebrafish larvae at 3 dpf. Nuclei are visualized with DAPI (blue). (C) NeuroD-positive cells are increased in sept7b knockdown larva compared to control MO-injected larvae. Error bars represent the standard error of mean. * p≤ 0.05. Scale bar: A, B (20 μm). |
Expression Data
Expression Detail
Antibody Labeling
Phenotype Data
Phenotype Detail
Acknowledgments
This image is the copyrighted work of the attributed author or publisher, and
ZFIN has permission only to display this image to its users.
Additional permissions should be obtained from the applicable author or publisher of the image.
Full text @ Sci. Rep.