
Fig. 2
- ID
- ZDB-FIG-170830-2
- Publication
- Rasouli et al., 2017 - Regulation of cardiomyocyte behavior in zebrafish trabeculation by Neuregulin 2a signaling
- Other Figures
- All Figure Page
- Back to All Figure Page
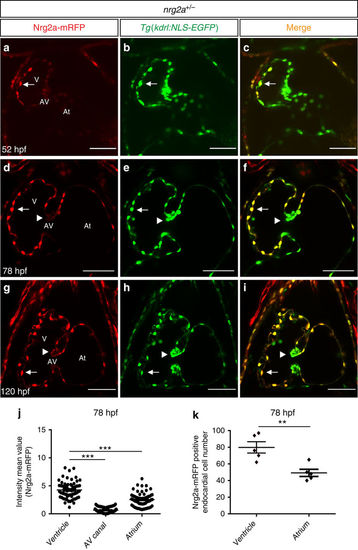
Nrg2a-mRFP expression during embryonic and larval cardiac development. (a–i) Two-dimensional (2D) confocal images (mid-sagittal sections) of zebrafish hearts from Tg(kdrl:NLS-EGFP);nrg2a+/− outcrosses at 52 (a–c), 78 (d–f) and 120 hpf (g–i) showing that Nrg2a-mRFP expression is clearly visible in the ventricular endocardium by 52 hpf, mainly in the outer curvature (a–c), and that it becomes stronger in both ventricular and atrial chambers at 78 and 120 hpf (d–i); however, it is weak in the atrioventricular canal; arrowheads point to the superior valve leaflet (a–i); AV, atrioventricular canal, At, atrium; V, ventricle; scale bars, 50 μm. (j) Cell-based mRFP intensity, measured with the ZEN Imaging Software and plotted as a graph, showing that Nrg2a-mRFP is more highly expressed in the ventricle compared to the AV canal and atrium; dots in this graph represent individual Nrg2a-mRFP expressing endocardial cells. (k) Nrg2a-mRFP positive endocardial cells counted in each chamber at 78 hpf, showing that there are more Nrg2a-mRFP positive endocardial cells in the ventricle than in the atrium at 78 hpf; dots in this graph represent individual hearts; N=5 hearts; values represent means±s.e.m.; **P≤0.01, ***P≤0.001 by Student’s t-test. |
| Genes: | |
|---|---|
| Fish: | |
| Anatomical Terms: | |
| Stage Range: | Long-pec to Day 5 |