
Fig. 4
- ID
- ZDB-FIG-170609-68
- Publication
- Gong et al., 2017 - The Sec14-like phosphatidylinositol transfer proteins Sec14l3/SEC14L2 act as GTPase proteins to mediate Wnt/Ca2+ signaling.
- Other Figures
- All Figure Page
- Back to All Figure Page
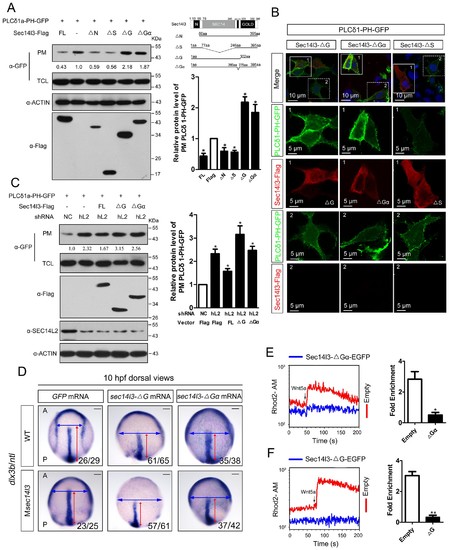
Sec14l3 activates PLC dependent on its GOLD and Gα domains. (A) Analysis of PIP2 levels in the membrane. Different forms of Sec14l3 (right corner) were co-transfected with PLCδ1-PH-GFP into HEK293T cells, and PIP2-bound PLCδ1-PH-GFP in the PM was detected by Western blot. The relative levels of PLCδ1-PH-GFP in the PM were quantified and presented as mean ± SEM from three independent experiments on the right (*p<0.05). (B) Immunofluorescence of PLCδ1-PH-GFP (green, PIP2 probe) in HEK293T transfected with Sec14l3-ΔG, Sec14l3-ΔGα or Sec14l3-ΔS (red) respectively. Regions in white box are enlarged. Scale bar, 10 μm for the first panel and 5 μm for the enlarged panels. (C) PIP2 accumulation in stable SEC14L2-knockdown cells was not abolished by overexpression of Sec14l3-ΔG or Sec14l3-ΔGα. Statistical data from three independent experiments are presented as mean ± SEM on the right (*p<0.05). (D) CE defects in embryos with ΔG and ΔGα Sec14l3 overexpression. dlx3b/ntl marker gene expression were examined at 10 hpf after sec14l3-ΔG and sec14l3-ΔGα mRNA injection respectively. Scale bar, 100 μm. (E–F) Flow cytometry of Wnt5a-induced calcium signals in PC3 cells transfected with Sec14l3-ΔGα or Sec14l3-ΔG (blue curves). Left panel shows the kinetic calcium influx over a time course. Right panel shows fold enrichment of calcium influx after Wnt5a stimulation. Data from three independent experiments are presented as mean ± SEM (*p<0.05, **p<0.01). Blue and red curves indicate the transfected and control group respectively. All numerical data represented as a graph in the figure are shown in Figure 4—source data 1. |