
Fig. 3
- ID
- ZDB-FIG-170609-65
- Publication
- Gong et al., 2017 - The Sec14-like phosphatidylinositol transfer proteins Sec14l3/SEC14L2 act as GTPase proteins to mediate Wnt/Ca2+ signaling.
- Other Figures
- All Figure Page
- Back to All Figure Page
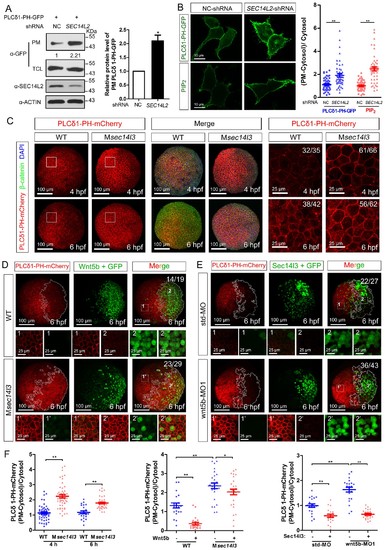
Sec14l3 facilitates PLC-catalyzed PIP2 hydrolysis induced by Wnt5b. (A) PM isolation analysis of PM PIP2 levels using PLCδ1-PH-GFP as probe in HEK293T cells. Quantification data from three independent experiments are shown as mean ± SEM (see also Figure 3—source data 1, *p<0.05). (B) Immunofluorescence of PLCδ1-PH-GFP in first panel (transfected with PLCδ1-PH-GFP) and endogenous PIP2 in second panel shows PIP2 accumulation in the PM of stable SEC14L2-knockdown HEK293T cells. Data are presented as mean ± SEM (see alsoFigure 3—source data 1, **p<0.01; n ≥ 50 cells from three separate experiments). Scale bar, 10 μm. (C) Immunofluorescence of PLCδ1-PH-mCherry (red, PIP2 probe), β-catenin (green, PM marker) and DAPI (blue, nucleus marker) shows PIP2 accumulation in the PM of Msec14l3 mutant cells. The first two whole embryo panels are 3D views of z-stacks (n = 30 for 4 hpf, n = 34 for 6 hpf), while the last panel is enlarged views of single z-stack pictures (z = 8 for 4 hpf, z = 7 for 6 hpf) from regions encompassed by white boxes. Scale bars, 100 μm for whole embryos; 25 μm for the enlarged columns. (D) Sec14l3 depletion compromises Wnt5b-induced degradation of PM PIP2. Immunofluorescence of PLCδ1-PH-mCherry (red) and GFP (green, indicating Wnt5b-expressed cells) is shown. Mosaic expression of 100 pg wnt5b mRNA was created in embryos with even distribution of PLCδ1-PH-mCherry mRNA. White polygons outline GFP expressed cells and single z-stack pictures (z = 10) from numbered regions in the whole embryo panels (3D view of z-stacks) are enlarged. Scale bars, 100 μm for whole embryos; 25 μm for the enlarged panels. (E) sec14l3 overexpression inhibits accumulation of PIP2 in wnt5b morphant embryos. Mosaic expression of sec14l3 by injecting 150 pg mRNA was created in embryos with even distribution of PLCδ1-PH-mCherry mRNA in std-MO or wnt5b-MO injected embryos. Single z-stack pictures (z = 11) from numbered regions in the whole embryo panels (3D view of z-stacks) are enlarged. (F) PM PIP2 quantification of (C–E) by calculating intensity of (PM-Cytosol)/Cytosol PLCδ1-PH-mCherry. Data are shown as mean ± SEM. (see also Figure 3—source data 1, **p<0.01; *p<0.05; ns, non-significant; n ≥ 50 cells from 10 embryos in three independent experiments). |