
Fig. 4
- ID
- ZDB-IMAGE-170609-63
- Publication
- Gong et al., 2017 - The Sec14-like phosphatidylinositol transfer proteins Sec14l3/SEC14L2 act as GTPase proteins to mediate Wnt/Ca2+ signaling.
- All Figures
- Figures for Gong et al., 2017
|
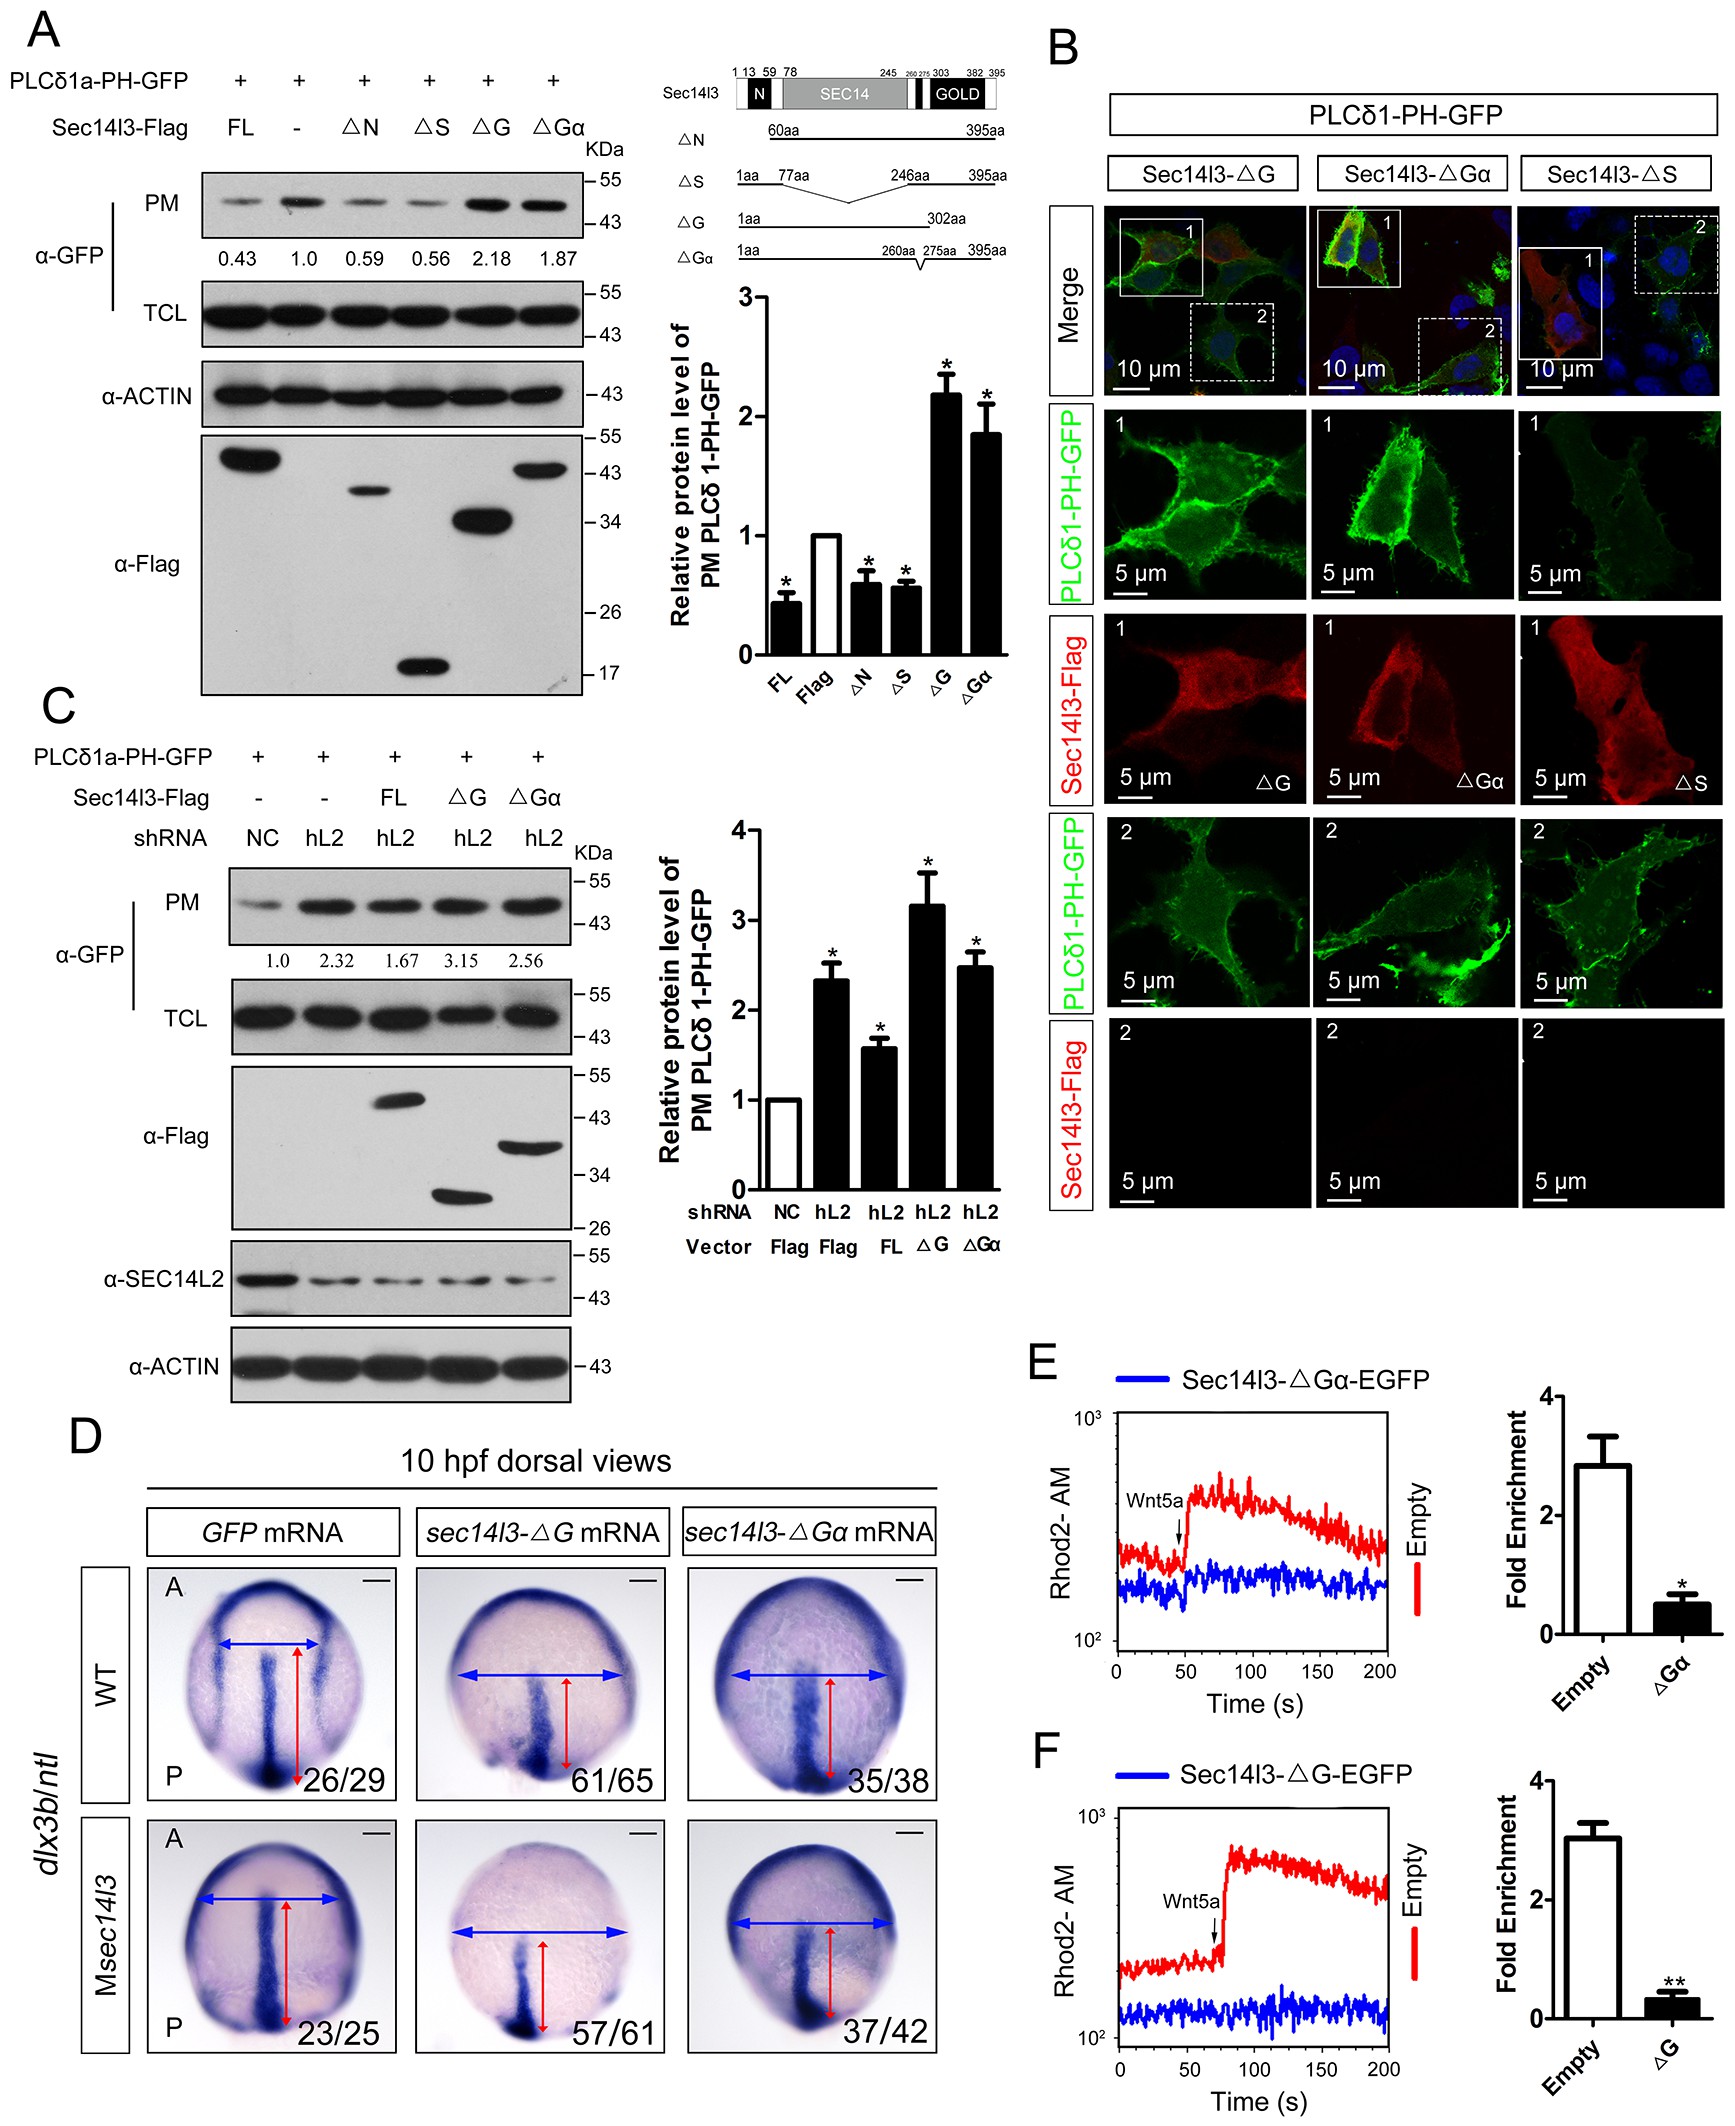
Fig. 4
Sec14l3 activates PLC dependent on its GOLD and Gα domains.
(A) Analysis of PIP2 levels in the membrane. Different forms of Sec14l3 (right corner) were co-transfected with PLCδ1-PH-GFP into HEK293T cells, and PIP2-bound PLCδ1-PH-GFP in the PM was detected by Western blot. The relative levels of PLCδ1-PH-GFP in the PM were quantified and presented as mean ± SEM from three independent experiments on the right (*p<0.05). (B) Immunofluorescence of PLCδ1-PH-GFP (green, PIP2 probe) in HEK293T transfected with Sec14l3-ΔG, Sec14l3-ΔGα or Sec14l3-ΔS (red) respectively. Regions in white box are enlarged. Scale bar, 10 μm for the first panel and 5 μm for the enlarged panels. (C) PIP2 accumulation in stable SEC14L2-knockdown cells was not abolished by overexpression of Sec14l3-ΔG or Sec14l3-ΔGα. Statistical data from three independent experiments are presented as mean ± SEM on the right (*p<0.05). (D) CE defects in embryos with ΔG and ΔGα Sec14l3 overexpression. dlx3b/ntl marker gene expression were examined at 10 hpf after sec14l3-ΔG and sec14l3-ΔGα mRNA injection respectively. Scale bar, 100 μm. (E–F) Flow cytometry of Wnt5a-induced calcium signals in PC3 cells transfected with Sec14l3-ΔGα or Sec14l3-ΔG (blue curves). Left panel shows the kinetic calcium influx over a time course. Right panel shows fold enrichment of calcium influx after Wnt5a stimulation. Data from three independent experiments are presented as mean ± SEM (*p<0.05, **p<0.01). Blue and red curves indicate the transfected and control group respectively. All numerical data represented as a graph in the figure are shown in Figure 4—source data 1.