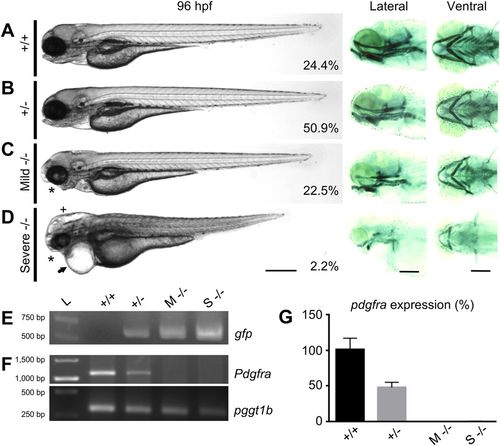
General phenotype analyses in pdgfra loss-of-function mutants. Panels showing bright field (left), and Alcian Blue-stained cartilaginous tissue (right) of WT (+/+) (A), heterozygous (+/−) (B), mild homozygous (Mild/M −/−) (C), and severe homozygous (Severe/S −/−) (D) GBT1300 siblings at 96 hpf. The percentage of fish in each group is indicated (n=275). While +/+ and +/− larvae show no visible abnormalities, mild −/− mutants exhibit craniofacial defects (asterisk) and abnormal swim bladder inflation. Severe −/− mutants demonstrate severe developmental defects, including craniofacial defects (asterisk), pericardial edema (arrow), hydrocephalus (cross), smaller body axis elongation, and abnormal cardiac and skeletal muscle. (E) PCR indicating the presence of gfp in +/−, mild −/− and severe −/−, but not in +/+ fish. (F) RT-PCR demonstrating reduction in endogenous pdgfra transcripts in mild −/− and severe −/−, compared to +/+ and +/− fish at 96 hpf. pggt1b used as a control for RT-PCR. (G) Relative amounts of pdgfra transcript confirming the loss of WT pdgfra transcripts in both mild −/− and severe −/− mutants at 96 hpf through qRT-RCR (P≤0.01; n=25/group; unpaired t test, error bars indicate s.e.m.). Scale bar: 250 μm. Anterior is to the left.
|
