
Fig. 4
- ID
- ZDB-FIG-170321-26
- Publication
- Liu et al., 2017 - Stat3/Cdc25a-dependent cell proliferation promotes embryonic axis extension during zebrafish gastrulation
- Other Figures
- All Figure Page
- Back to All Figure Page
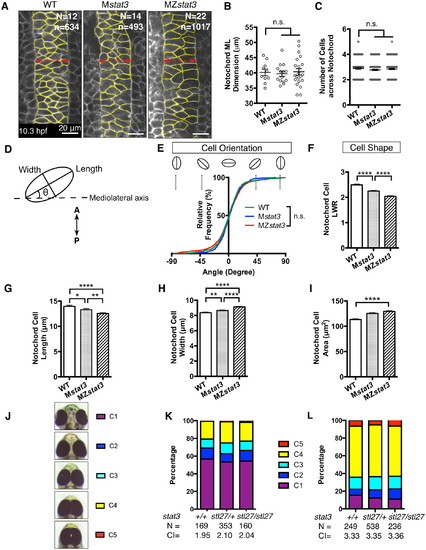
MZstat3 mutants show neither obvious cell polarity defects during C&E nor interaction with zebrafish PCP mutants. (A) Confocal image of dorsal mesoderm in WT, Mstat3, and MZstat3 1-somite stage embryos labeled with mGFP (anterior to the top). Cell shape and orientation of notochord cells outlined in yellow were analyzed as illustrated in D. (B) Measurement of notochord width at 1-somite stage. (C) Quantification of the number of cells across the ML notochord axis at 1-somite stage. (E) Cumulative distribution of notochord cell orientation in WT, Mstat3, and MZstat3 embryos. (F) Cell shape analysis represented by length-to-width ratio (LWR). (G-I) Long axis (length, G), short axis (width, H) and average area (I) of in WT, Mstat3 and MZstat3 notochord cells. (J) A spectrum of eye separation phenotypes at 3 dpf with C1 representing WT eye spacing and C5 representing the most severe phenotype, cyclopia. Ventral view, anterior to the top. (K) Penetrance and expressivity of eye separation phenotypes of Ztri, Ztri;Zstat3stl27/+, and Ztri;Zstat3 embryos. Eye separation phenotypes were also quantified by cyclopia index (CI) as previously described [36].(L) Penetrance and expressivity of eye separation phenotypes of MZslb, MZslb;Zstat3stl27/+, and MZslb;Zstat3 embryos. ****p<0.0001, n.s. = non-significant, error bars = SEM. See also S4 Fig. |
| Fish: | |
|---|---|
| Observed In: | |
| Stage Range: | 1-4 somites to Protruding-mouth |