
FIGURE
Fig. S6
Fig. S6
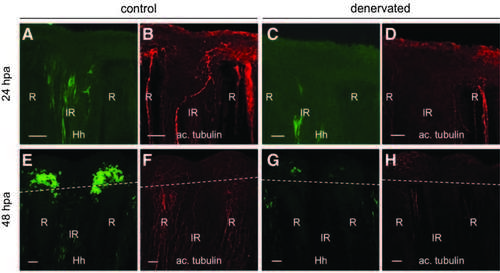
Shh-expressing cell behavior in the time course of regeneration after denervation. Immunofluorescence staining for GFP (shh:GFP) and axons (antiacetylated tubulin) in a control fin (A, B, E, F) and fin denervated in the dorsal part (C, D, G, H) at 24 hpa (A–D) or 48 hpa (E–H). Scale bars = 50 lM. R, ray; IR, inter-ray. Dashed line: amputation plane. |
Expression Data
Expression Detail
Antibody Labeling
Phenotype Data
Phenotype Detail
Acknowledgments
This image is the copyrighted work of the attributed author or publisher, and
ZFIN has permission only to display this image to its users.
Additional permissions should be obtained from the applicable author or publisher of the image.
Full text @ Antioxid. Redox Signal.