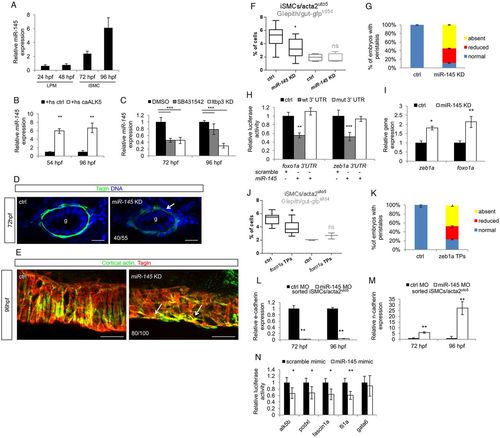
Zeb1a and Foxo1a are regulated by the TGFβ-dependent miR-145 expression. (A) miR-145 expression occurs from 72 hpf onwards in zebrafish embryos. Time-course analysis of miR-145 expression in whole zebrafish embryos. qPCR was performed on total RNA extracted from embryos at the indicated developmental stages. Values are normalized to miR-145 levels in unfertilized eggs. (B) Alk5 activation promotes miR-145 transcription and maturation. Histograms show the levels of mature miR-145 after activation of Alk5 signaling using the inducible Tg(hsp70:caALK5) line, as assessed by qRT-PCR analyses. (C) Blockade of Alk5 signaling significantly reduced mature miR-145 levels. Histograms show the levels of mature miR-145 after pharmacological (SB431542) and genetic (ltbp3 knockdown) inactivation of Alk5 signaling compared with controls, as assessed by qRT-PCR. (D) miR-145 knockdown in zebrafish embryos impairs iSMC maturation. Confocal transverse sections of miR-145 knockdown embryos stained for Tagln (green). Knockdown of miR-145 alters iSMC maturation as displayed by irregular morphology and shape of iSMCs compared with controls (arrow). The number of embryos exhibiting this phenotype is indicated. Nuclei are in blue. Scale bars: 15 μm. (E) miR-145 knockdown alters iSMC organization in the intestine. Confocal maximum projection of iSMCs covering the gut after staining for Tagln (green) and cortical actin (red). miR-145 knockdown embryos showed abnormal endoderm coverage and iSMC morphology (arrows) compared with controls. The number of embryos exhibiting this phenotype is indicated. Scale bars: 25 μm. (F) miR-145 knockdown reduces iSMC number without affecting endoderm differentiation. Box and whisker plots show the percentage of iSMCs and endodermal cells isolated by fluorescent-activated cell sorting (FACS) experiments from the trunks of double Tg(acta2:mcherry)uto5 (Xia.Eef1a1:GFP)s854 embryos at 96 hpf after miR-145 knockdown. The boxplots show the maximum, minimum, upper and lower quartiles, and the sample median. Asterisks represent the results of unpaired t-tests of mean difference=0 (*P<0.05; from left to right: n=10, n=10, n=5 and n=5 groups of 10-20 embryos). (G) Loss of miR-145 impairs gut peristalsis in zebrafish embryos. Histograms show the percentage of embryos with peristaltic gut movement at 96 hpf after miR-145 knockdown. (H) Zebrafish zeb1a and foxo1a mRNA are directly bound by miR-145. The histogram shows luciferase activity in mammalian cells co-transfected with reporter constructs containing wild-type or mutant (mut) zeb1a and foxo1a 3′ UTR, together with a miR-145 mimic or a scramble mimic. The results are shown as the mean±s.d. of Firefly luciferase activity relative to the controls, normalized with respect to Renilla luciferase activity. Asterisks represent the results of one-way ANOVA-Dunnett's post-hoc test (**P<0.01, ***P<0.001). (I) miR-145 knockdown increases foxo1a and zeb1a levels as evaluated by qPCR on the trunk region of embryos at 96 hpf (*P<0.05, **P<0.01). (J) The block of miR-145 and foxo1a binding in vivo reduces iSMC number without affecting endoderm differentiation. Box and whisker plots show the percentage of iSMCs or endodermal cells isolated by fluorescent-activated cell sorting (FACS) experiments from the trunk of the double Tg(acta2:mCherry)uto5 (Xia.Eef1a1:GFP)s854 embryos at 96 hpf after foxo1a target protector (TPs) injection. The boxplots show the maximum, minimum, upper and lower quartiles, and the sample median. Asterisks represent the results of unpaired t-tests of mean difference=0 (*P<0.05; from left to right: n=7, n=7, n=3 and n=3 groups of 10-20 embryos). (K) Block of miR-145-zeb1a binding in vivo affects gut peristalsis in zebrafish embryos. Histograms show the percentage of embryos with peristaltic gut movement at 96 hpf after zeb1a TP injections. (L,M) miR-145 knockdown upregulates the mesenchymal program in iSMCs. Histograms show E-cadherin (L) and N-cadherin (M) mRNA levels evaluated by qRT-PCR in iSMCs sorted from Tg(acta2:mCherry)uto5 embryos after miR-145 knockdown compared with control levels at 72 and 96 hpf. miR-145 knockdown severely reduced E-cadherin mRNA levels but promoted N-cadherin mRNA expression. These data suggest that miR-145 is required to switch off the mesenchymalization program in iSMCs responsible for their appearance (**P<0.01). (N) miR-145 directly targets Alk5 and several genes required for pEMT. Histograms show relative luciferase activity in cells co-transfected with reporter constructs containing the 3′ UTR of alk5, podxl, fascin1a, fli1a and gata6 together with a miR-145 mimic or a scramble mimic. The results are shown as the mean±s.d. of Firefly luciferase activity relative to controls, normalized to Renilla luciferase activity. The data indicate that miR-145 targets the Alk5 receptor, as well as other mesenchymal genes, such as podxl, fascin and fli1a (*P<0.05, **P<0.01). gata6, a known miR-145 target, was used as a control.
|
