
Fig. 3 S1
- ID
- ZDB-FIG-170222-8
- Publication
- Tenente et al., 2017 - Myogenic regulatory transcription factors regulate growth in rhabdomyosarcoma
- Other Figures
- All Figure Page
- Back to All Figure Page
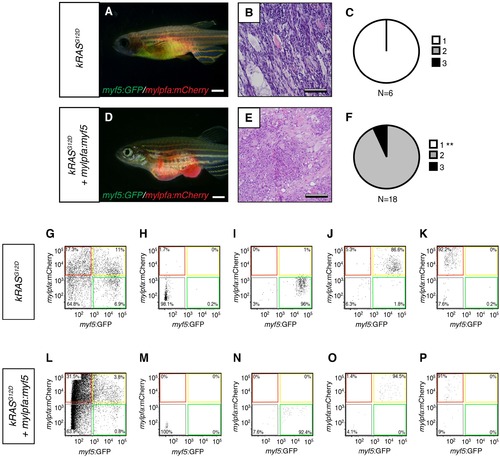
Analysis of transplanted ERMS arising in CG1-strain syngeneic recpients. (A,D) Representative images of transplanted fish. ERMS were created in myf5-GFP/mylpfa-mCherry transgenic, CG1-strain syngeneic zebrafish and imaged following 30 days of engraftment. Genotypes denoted to the left. (B,E) Representative histology of transplanted tumors. (C,F) Quantification of differentiation based on histological review (1-less differentiated and 3-most differentiated). **p<0.01 by Chi-square test. (G–P) Representative examples of sort purity following FACS for cells used in limiting dilution cell transplantation experiments. (G–K) Sort purity following FACS for a representative kRASG12D-alone expressing ERMS and (L–P) kRASG12D+ mylpfa:myf5 expressing ERMS (data is reproduced in lower left panels of Figure 3D and G). Scale bars equal 2 mm (A,D) and 100 μm (B,E). |