
Fig. 2
- ID
- ZDB-FIG-170222-5
- Publication
- Tenente et al., 2017 - Myogenic regulatory transcription factors regulate growth in rhabdomyosarcoma
- Other Figures
- All Figure Page
- Back to All Figure Page
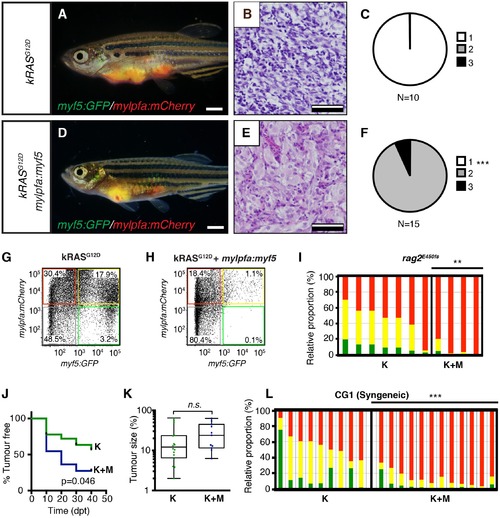
Tumors that transgenically express myf5 are fully transformed and retain a differentiated phenotype following engraftment into recipient animals. (A–F) Analysis of ERMS arising in transplanted fish. kRASG12D expressing ERMS arising in rag2E450fs transplant recipient fish (A–C) compared with those that express both kRASG12D and mylpfa:myf5 (D–F). Tumors were created in stable transgenic myf5:GFP/mylpfa:mCherry transgenic, AB-strain zebrafish and imaged following engraftment into recipient fish at 30 days post transplantation (dpt). Hematoxylin and eosin stained sections of representative tumors (B,E) and quantification of differentiation within individual ERMS (C,F; 1-less differentiated and 3-most differentiated). Asterisks denote p<0.001 by Chi-square test. (G,H) Representative flow cytometry analysis of fluorescently-labeled ERMS cells isolated from transplanted rag2E450fs zebrafish. (I) Graphical summary of ERMS cell sub-fractions that grow following engraftment into immune-deficient rag2E450fs recipients. Individual tumors are represented as separate bars with the proportion of G+ (green), G+R+ (yellow) and R+ (red) sub-populations denoted. **p=0.006. (J) Kaplan-Meijer analysis showing time-to-tumor onset in transplanted ERMS arising in rag2E450fs zebrafish (p=0.046, Log-rank Statistic, 2 × 10⁵ cells/fish, N > 12 animals per arm, representing ≥3 independently-arising primary ERMS). (K) Relative tumor size at 30 days post engraftment (same animals analyzed as in J). (L) ERMS cells were also more differentiated following engraftment of myf5:GFP/mylpfa:mCherry ERMS cells into syngeneic recipient fish (p<0.001, Student’s T-test, N ≥ 3 independently arising primary ERMS and assessed in n ≥ 2 animals per transplanted tumor). Scale bars equal 2 mm (A,D) and 50 μm (B,E). |