
Fig. 1 S3
- ID
- ZDB-FIG-170222-4
- Publication
- Tenente et al., 2017 - Myogenic regulatory transcription factors regulate growth in rhabdomyosarcoma
- Other Figures
- All Figure Page
- Back to All Figure Page
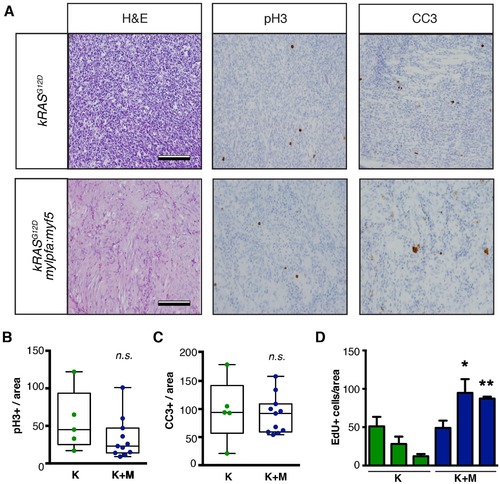
Analysis of proliferation and apoptosis in zebrafish primary ERMS. (A) Representative H and E-stained sections and immunohistochemistry for phospho-H3 (pH3) and cleaved caspase-3 (CC3). (B) Quantification of the total number of pH3-positive cells per 400x imaging field. (n=average of 3 fields/tumor section). (C) Quantification of the total number of CC3-positive cells per 400x imaging field (n=average of 3 fields/tumor). Boxes in B–C denote 50% confidence interval and mean, maximum, and minimum shown. kRASG12D[K] (N = 5) and kRASG12D; mylpfa:myf5 [K+M] (N = 11). (D) Quantification of total number of EdU+ cells per area (n=average of 3 fields/tumor. N = 3 tumors per genotype). *p<0.05 or **p<0.01 in comparison to each kRASG12D-alone expressing ERMS (Student’s t-test). Error bars denote +/- STD. Scale bars equal 100 μm (A). Not significant by Student’s t-test (n.s.). |