
Fig. 5
- ID
- ZDB-FIG-170201-27
- Publication
- Rydeen et al., 2016 - Cyp26 Enzymes Facilitate Second Heart Field Progenitor Addition and Maintenance of Ventricular Integrity
- Other Figures
- All Figure Page
- Back to All Figure Page
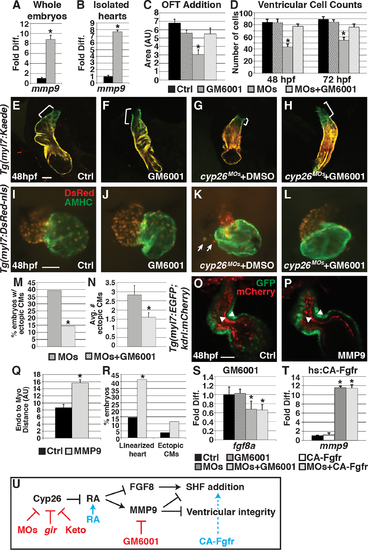
Attenuating MMP function restores SHF addition and ventricular integrity. (A,B) Graphs indicating fold difference of mRNA relative to β-actin assayed with RT-qPCR of mmp9 expression in whole embryos and isolated hearts at 48 hpf. (C) Graph showing quantification of ventricular addition to the OFT (control n = 11, GM6001 treated n = 11, Cyp26 deficient n = 12, Cyp26 deficient + GM6001 n = 12). (D) Graph depicting ventricular cardiomyocyte counts at 48 and 72 hpf (n = 10 per group). (E–H) Confocal images of optical slices from hearts of Tg(myl7:Kaede) embryos at 48 hpf after photoconversion at 36 hpf. Brackets indicate ventricular addition (green only). (I–L) IHC of hearts from control and Cyp26-deficient Tg(myl7:DsRed-NLS) embryos after DMSO or GM6001 treatment. Arrows indicate ectopic cardiomyocytes. (M) Graph depicting the percentage of embryos with ectopic cardiomyocytes in Cyp26 deficient treated with DMSO or GM6001 at 48 hpf. (N) Graph depicting average number of ectopic cardiomyocytes (per embryo with ectopic cardiomyocytes) at 48 hpf. (O,P) Confocal images of optical slices through control (lineage tracer alone) or activated MMP9-injected Tg(myl7:EGFP);Tg(kdrl:mCherry) hearts at 48 hpf. Arrowheads denote the inner border of endocardial and outer border of myocardial cells. (Q) Graph depicting the quantification of the distance between the endocardium and myocardium (control n = 12, MMP9 injected n = 10). (R) Graph depicting the percentage of embryos with linearized, dysmoprhic hearts and cells outside the heart (n > 50 per group). (S) Graph indicating fold difference of mRNA relative to β-actin assayed with RT-qPCR of fgf8a expression at 48 hpf in control and Cyp26-deficient embryos treated with DMSO or GM6001. (T) Graph indicating fold difference of mRNA relative to β-actin assayed with RT-qPCR of mmp9 expression at 48 hpf after heat-shock induction of CA-Fgfr1. (U) Model of Cyp26 enzyme function in the ventricular OFT development. Red indicates reagents used to inhibit function. Blue indicates reagents used to activate function. Controls in C–E, I, and S were DMSO treated. Controls in O, Q, R indicate Cascade blue-dextran injected alone. Error bars are SEM, asterisks denote p < 0.05 compared to controls by Student’s t test (A–D,N,Q–T), asterisk denotes p<0.05 by Chi Squared test (M). Frontal views, anterior up (E–L,M,N); n > 20 embryos per group (E–L,M,N). CMs, cardiomyocytes. Scale bar: 50 μm. |
| Genes: | |
|---|---|
| Antibody: | |
| Fish: | |
| Condition: | |
| Knockdown Reagents: | |
| Anatomical Terms: | |
| Stage: | Long-pec |
| Fish: | |
|---|---|
| Condition: | |
| Knockdown Reagents: | |
| Observed In: | |
| Stage Range: | Long-pec to Protruding-mouth |